60 Charles St


1 / 11
MLS Restricted Listing
Free account required. or to see all the details.
Free account required. or to see all the details.
Listing History
Unit Highlights
MLS Restricted Listing
Free account required. or to see all the details.
Free account required. or to see all the details.
Renter's Market
Balanced
Landlord's Market
Utilities Included
Rent Includes
None
Excluded
Hydro
Heat
Air Conditioning
Water
Utility Type
- Air Conditioning
- Central Air
- Heat Source
- Gas
- Heating
- Forced Air
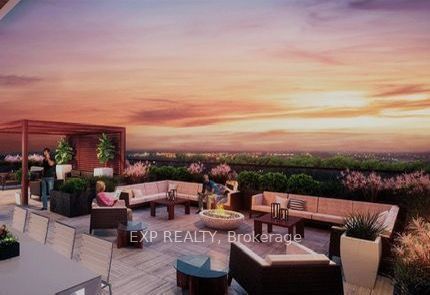
Amenities
Rooftop Deck
Guest Suites
Gym Room
Visitor Parking
Party Room
BBQ
Explore Neighbourhood
Unknown
Walkability
Unknown
Transit
Unknown
Bikeability
Similar Listings
Price Trends
Maintenance Fees
Charlie West vs The City Commercial Core Area
Building Trends At Charlie West
Days on Strata
Units at Charlie West spend an average of
24
Days on Strata
based on recent sales
List vs Selling Price
On average, these condos sell for
2%
below
the list price.
Offer Competition
Condos in this building have an
AVERAGEchance of receiving
Multiple Offers
compared to other buildings in City Commercial Core
Turnover of Units
On average, each unit is owned for
N/A
Property Value
-6%
Decrease in property value within the past twelve months
Price Ranking
2nd
Highest price per SQFT out of 12 condos in the City Commercial Core area
Sold Units
5
Units were Sold over the past twelve months
Rented Units
14
Units were Rented over the past twelve months
Best Value Rank
Charlie West offers the best value out of 12 condos in the City Commercial Core neighbourhood
?
N/A
Appreciation Rank
Charlie West has the highest ROI out of 12 condos in the City Commercial Core neighbourhood
?
N/A
Rental Yield
Charlie West yields the highest rent prices out of 12 condos in the City Commercial Core neighbourhood
?
N/A
High Demand
Charlie West is the most popular building out of 12 condos in the City Commercial Core neighbourhood
?
N/A
Transaction Insights at 60 Charles Street W
| 1 Bed | 1 Bed + Den | 2 Bed | 2 Bed + Den | |
|---|---|---|---|---|
| Price Range | $425,000 - $475,000 | $505,000 - $520,000 | $540,000 | No Data |
| Avg. Cost Per Sqft | $721 | $672 | $687 | No Data |
| Price Range | $1,700 - $2,200 | $1,980 - $2,100 | $2,500 - $2,550 | No Data |
| Avg. Wait for Unit Availability | 51 Days | 112 Days | 157 Days | No Data |
| Avg. Wait for Unit Availability | 37 Days | 125 Days | 401 Days | No Data |
| Ratio of Units in Building | 62% | 19% | 19% | 2% |
Transactions vs Inventory
Total number of units listed and leased in City Commercial Core
