702 - 9 Northern Heights Dr
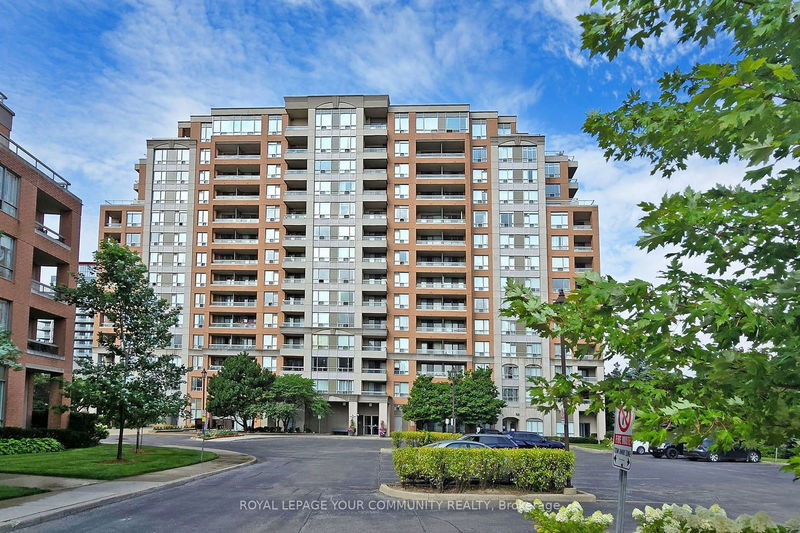


For SaleEmpire Place on Yonge III CondosEst Sell Timeframe 11 Days
$598,000
1 Bed + 1
1 Bath
1 Parking
675 SQFT
15 Days on Strata
Listing History
Unit Highlights
Property Type:
Condo
Maintenance Fees:
$634/mth
Taxes:
$1,917 (2024)
Cost Per Sqft:
$886/sqft
Locker:
Exclusive
Outdoor Space:
Balcony
Exposure:
East
Possession Date:
Immediately/TBA
Laundry:
Ensuite
Buyer's Market
Balanced
Seller's Market
Maintenance Fees
Included
Hydro
Heat
Air Conditioning
Water
Parking
Building Maintenance
Building Insurance
Excluded
None
Utility Type
- Air Conditioning
- Central Air
- Heat Source
- Gas
- Heating
- Forced Air
Room Dimensions
Living
Hardwood Floor, Combined with Dining, Walkout To Balcony
20.01 x 10.07ft
Dining
Hardwood Floor, Combined with Living
20.01 x 10.07ft
Kitchen
Breakfast Bar, Granite Counter
8.3 x 8.1ft
About this Listing
Absolutely Gorgeous Condo unit in the Gated Community of Empire Place on Yonge! One of the nicest Floor plans with spacious Primary bedroom with W/O to large Balcony + East Exposure. Den with French Doors can be used as 2nd Bedroom. 24 Hr Concierge, gatehouse security. Very Convenient location. walk to amenities and Hillcrest Mall. Ample visitor parking.
ExtrasWasher/Dryer, Fridge, Stove, B/I Dishwasher, Existing Elfs + Blinds
royal lepage your community realtyMLS® #N9304233
Amenities
Security System
Gym Room
Party Room
Indoor Pool
Guest Suites
Concierge
Explore Neighbourhood
5/10
Walkability
Halfway to a walker's paradise, you might want to invest in a hoverboard.
6/10
Transit
You won't need to read all of 'War and Peace' at the bus stop... just a few chapters.
5/10
Bikeability
A perfect balance of challenge and 'Hey, I didn’t know there was a bike shop here!'
Similar Listings
Demographics
Based on the dissemination area as defined by Statistics Canada. A dissemination area contains, on average, approximately 200 – 400 households.
Population
22,351
Average Individual Income
$84,468
Average Household Size
3 persons
Average Age
44
Average Household Income
$157,689
Dominant Housing Type
Detached
Population By Age
Household Income
Housing Types & Tenancy
Detached
81%
Semi Detached
12%
Duplex
4%
Low Rise Apartment
2%
Marital Status
Commute
Languages (Primary Language)
English
84%
Other
9%
Mandarin
3%
Cantonese
2%
Russian
1%
Punjabi
1%
Education
University and Above
29%
High School
28%
College
19%
None
13%
Apprenticeship
5%
University Below Batchelor
2%
Major Field of Study
Business Management
23%
Architecture & Engineering
19%
Social Sciences
12%
Health & Related Fields
11%
Education
6%
Personal, Protective & Transportation Services
5%
Humanities
5%
Math & Computer Sciences
5%
Physical Sciences
4%
Visual & Performing Arts
3%
Agriculture & Natural Resources
1%
Price Trends
Maintenance Fees
Empire Place on Yonge III Condos vs The Langstaff Area
Building Trends At Empire Place on Yonge III Condos
Days on Strata
Units at Empire Place on Yonge III Condos spend an average of
49
Days on Strata
based on recent sales
List vs Selling Price
On average, these condos sell for
6%
below
the list price.
Offer Competition
Condos in this building have a
LOWchance of receiving
Multiple Offers
compared to other buildings in Langstaff
Turnover of Units
On average, each unit is owned for
5.7
YEARS before being sold againProperty Value
-4%
Decrease in property value within the past twelve months
Price Ranking
15th
Highest price per SQFT out of 25 condos in the Langstaff area
Sold Units
7
Units were Sold over the past twelve months
Rented Units
5
Units were Rented over the past twelve months
Best Value Rank
Empire Place on Yonge III Condos offers the best value out of 25 condos in the Langstaff neighbourhood
?
Appreciation Rank
Empire Place on Yonge III Condos has the highest ROI out of 25 condos in the Langstaff neighbourhood
?
Rental Yield
Empire Place on Yonge III Condos yields the highest rent prices out of 25 condos in the Langstaff neighbourhood
?
High Demand
Empire Place on Yonge III Condos is the most popular building out of 25 condos in the Langstaff neighbourhood
?
Transaction Insights at 9 Northern Heights Drive
| 1 Bed | 1 Bed + Den | 2 Bed | 2 Bed + Den | 3 Bed | 3 Bed + Den | |
|---|---|---|---|---|---|---|
| Price Range | $530,000 - $535,000 | $575,000 | $542,000 - $718,000 | No Data | No Data | $2,000,000 |
| Avg. Cost Per Sqft | $840 | $880 | $777 | No Data | No Data | $850 |
| Price Range | No Data | $2,600 | $3,400 - $3,675 | No Data | No Data | No Data |
| Avg. Wait for Unit Availability | 143 Days | 142 Days | 92 Days | 1291 Days | No Data | 3324 Days |
| Avg. Wait for Unit Availability | 147 Days | 117 Days | 114 Days | No Data | No Data | No Data |
| Ratio of Units in Building | 27% | 25% | 40% | 5% | 5% | 1% |
Transactions vs Inventory
Total number of units listed and sold in Langstaff
