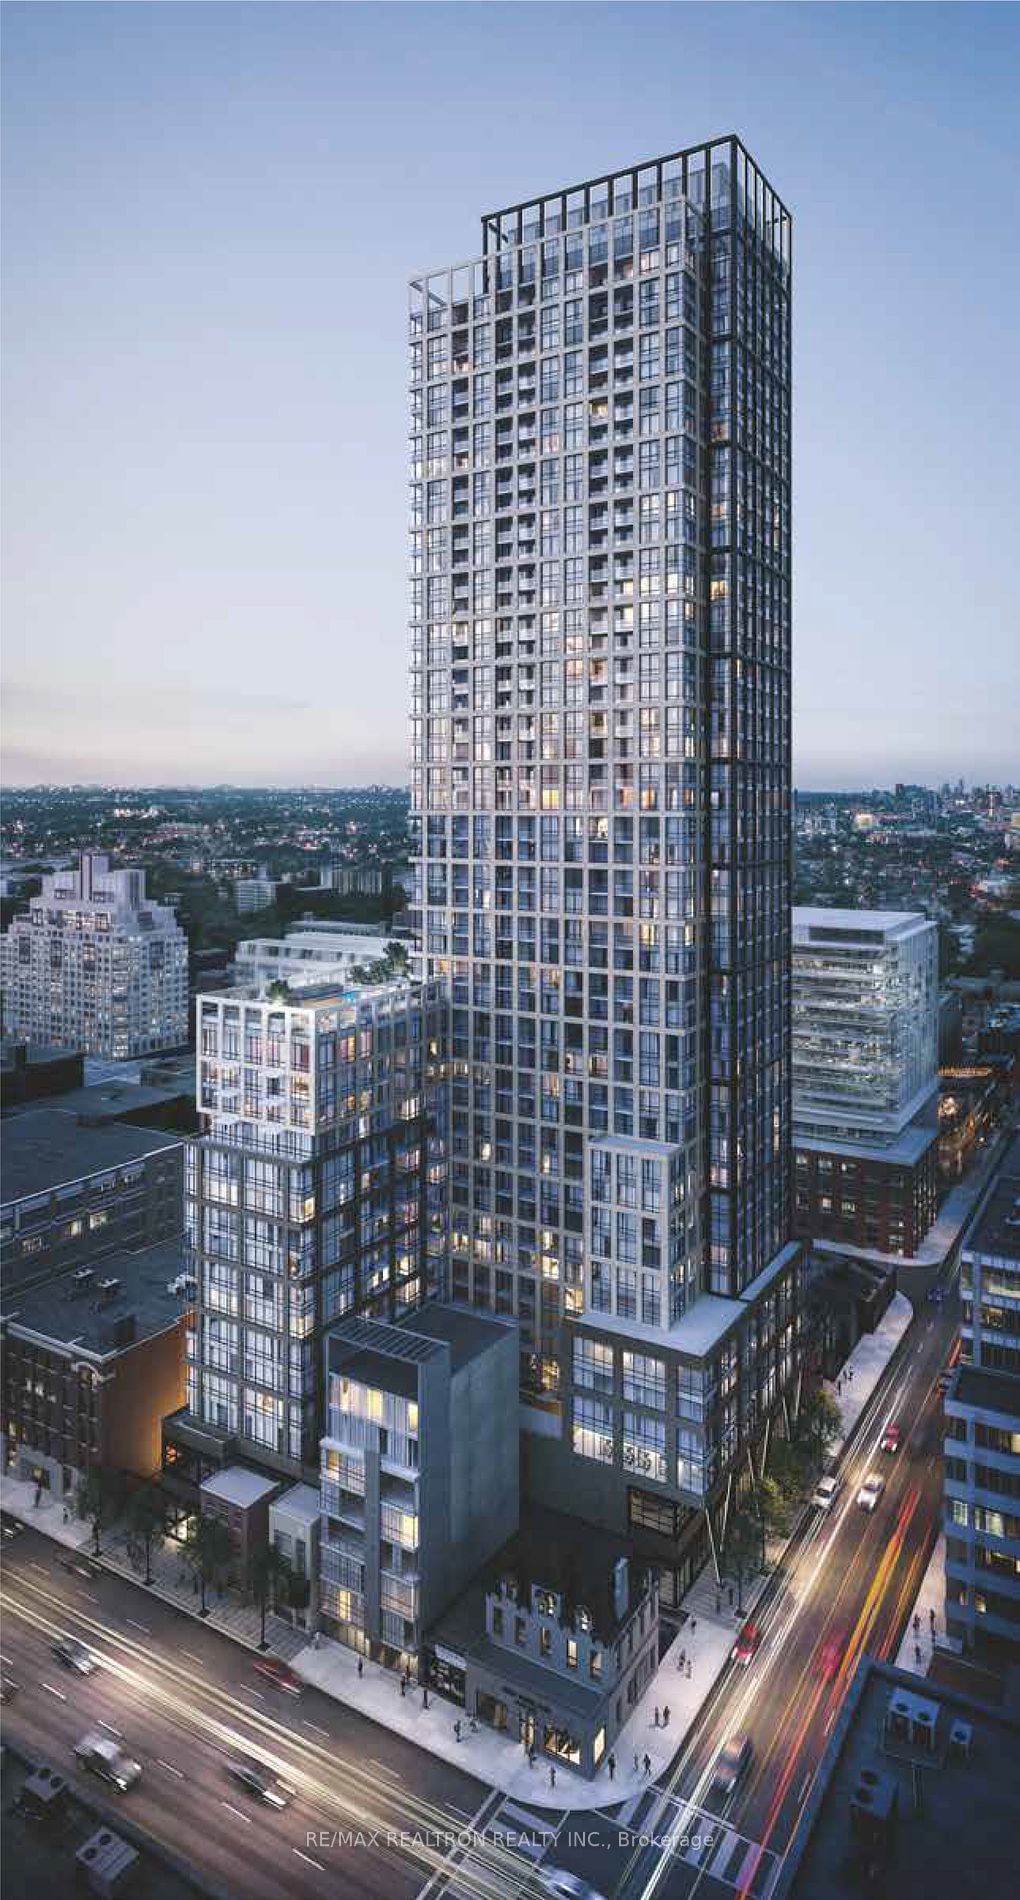
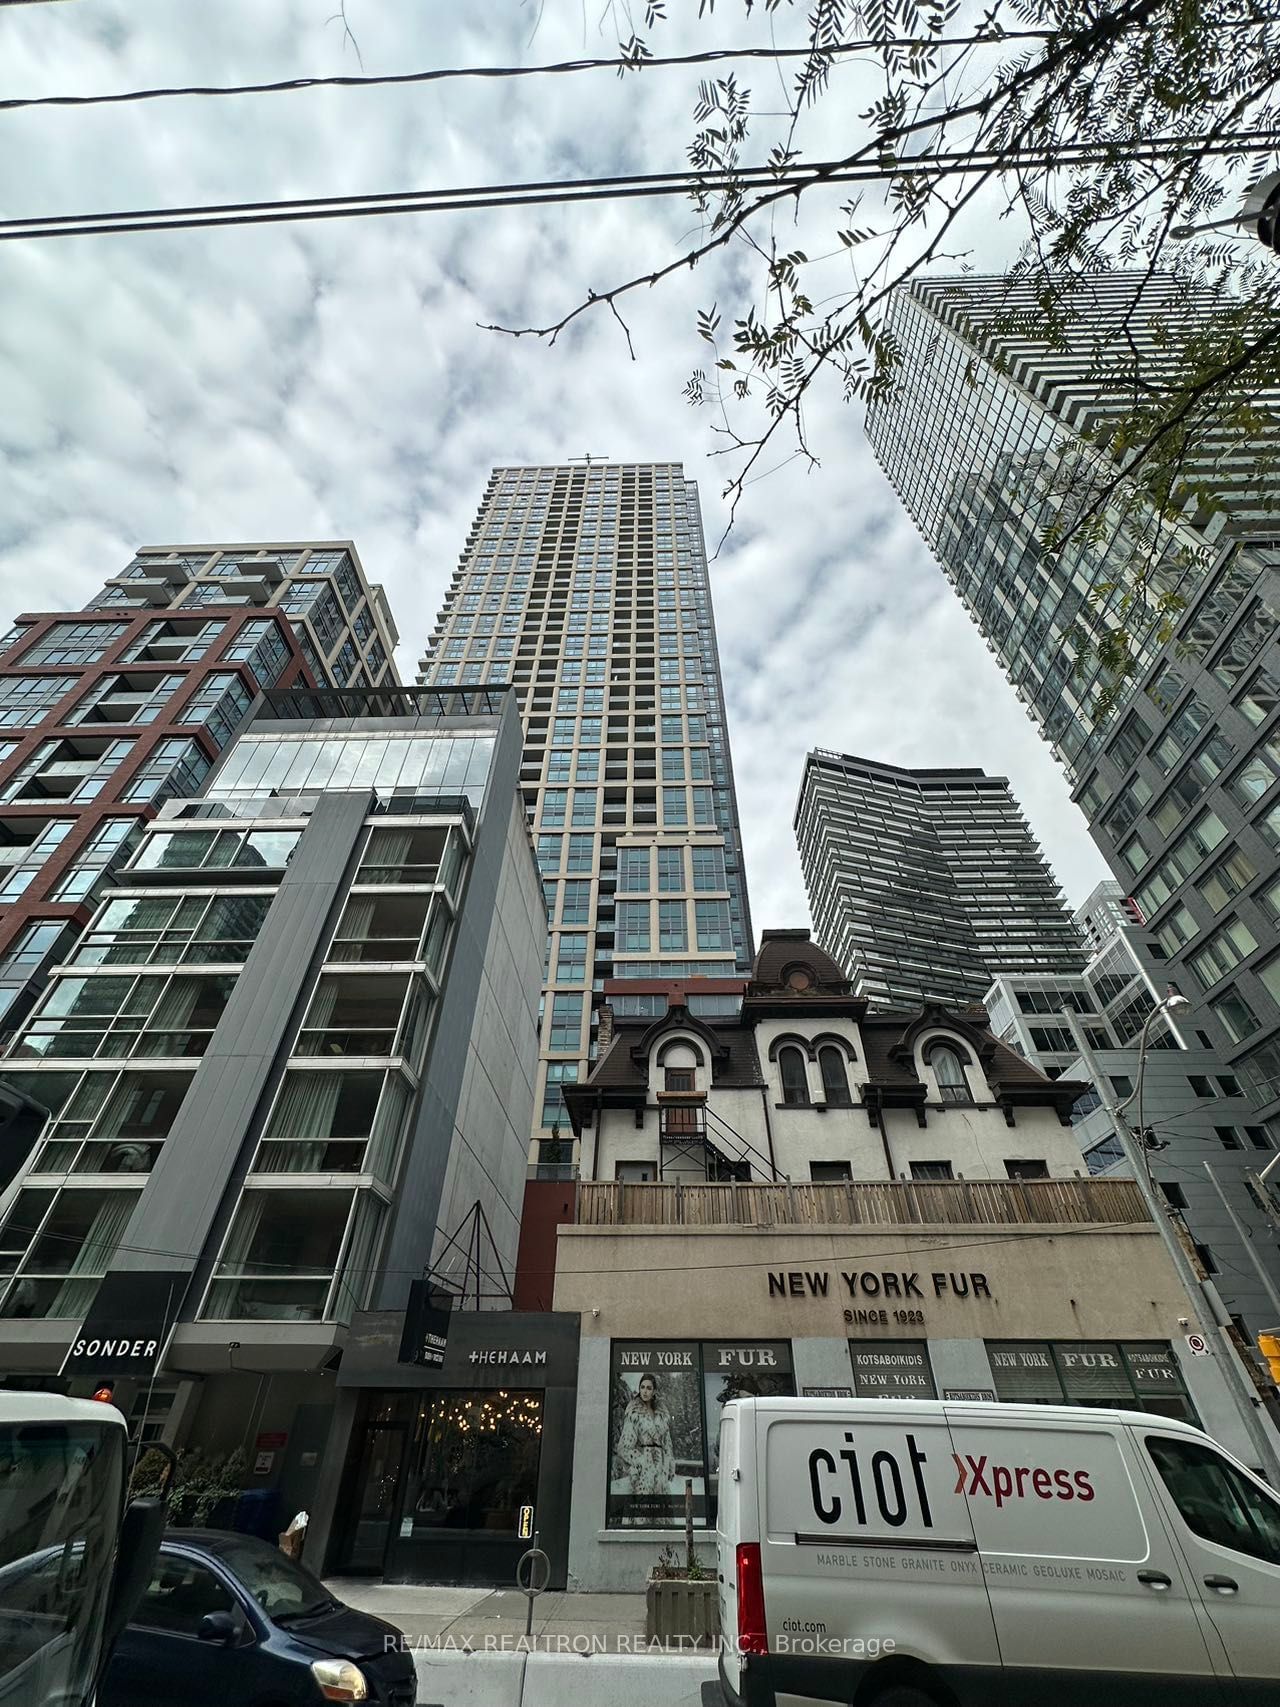
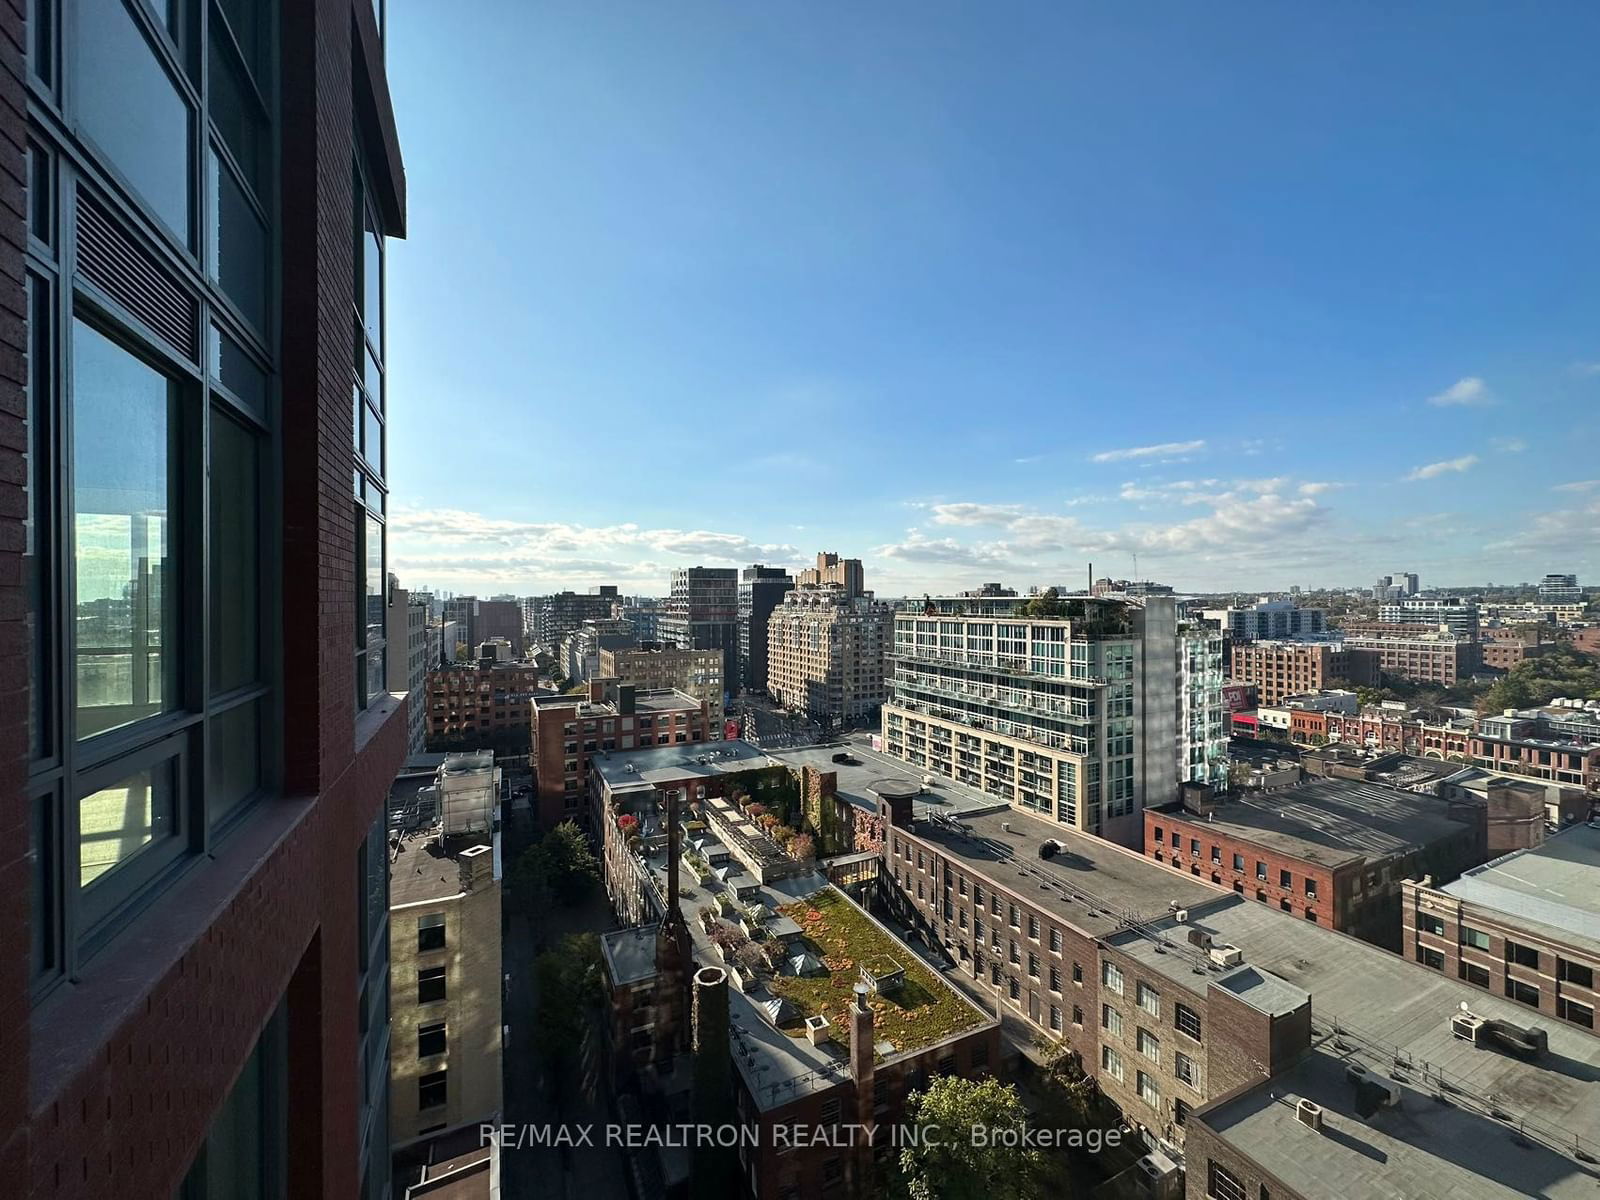
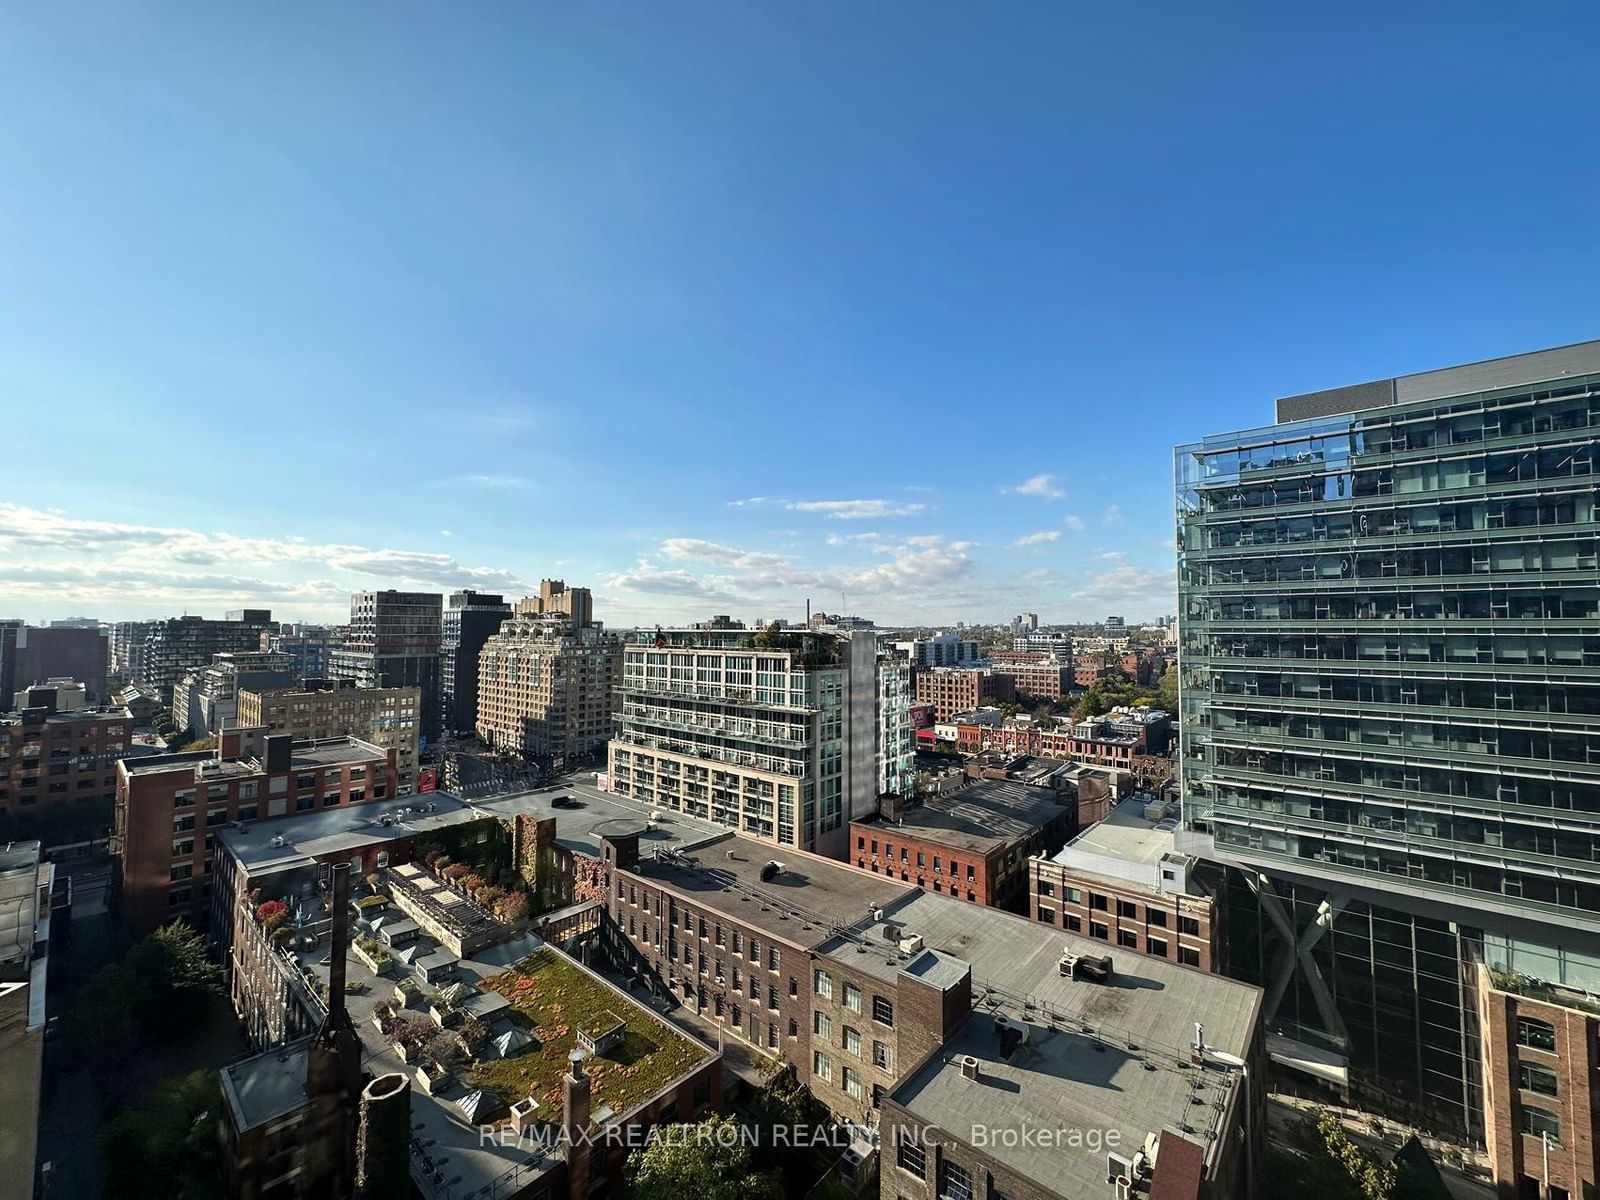
1621 - 108 Peter St
Listing History
Unit Highlights
Utilities Included
Utility Type
- Air Conditioning
- Central Air
- Heat Source
- Gas
- Heating
- Forced Air
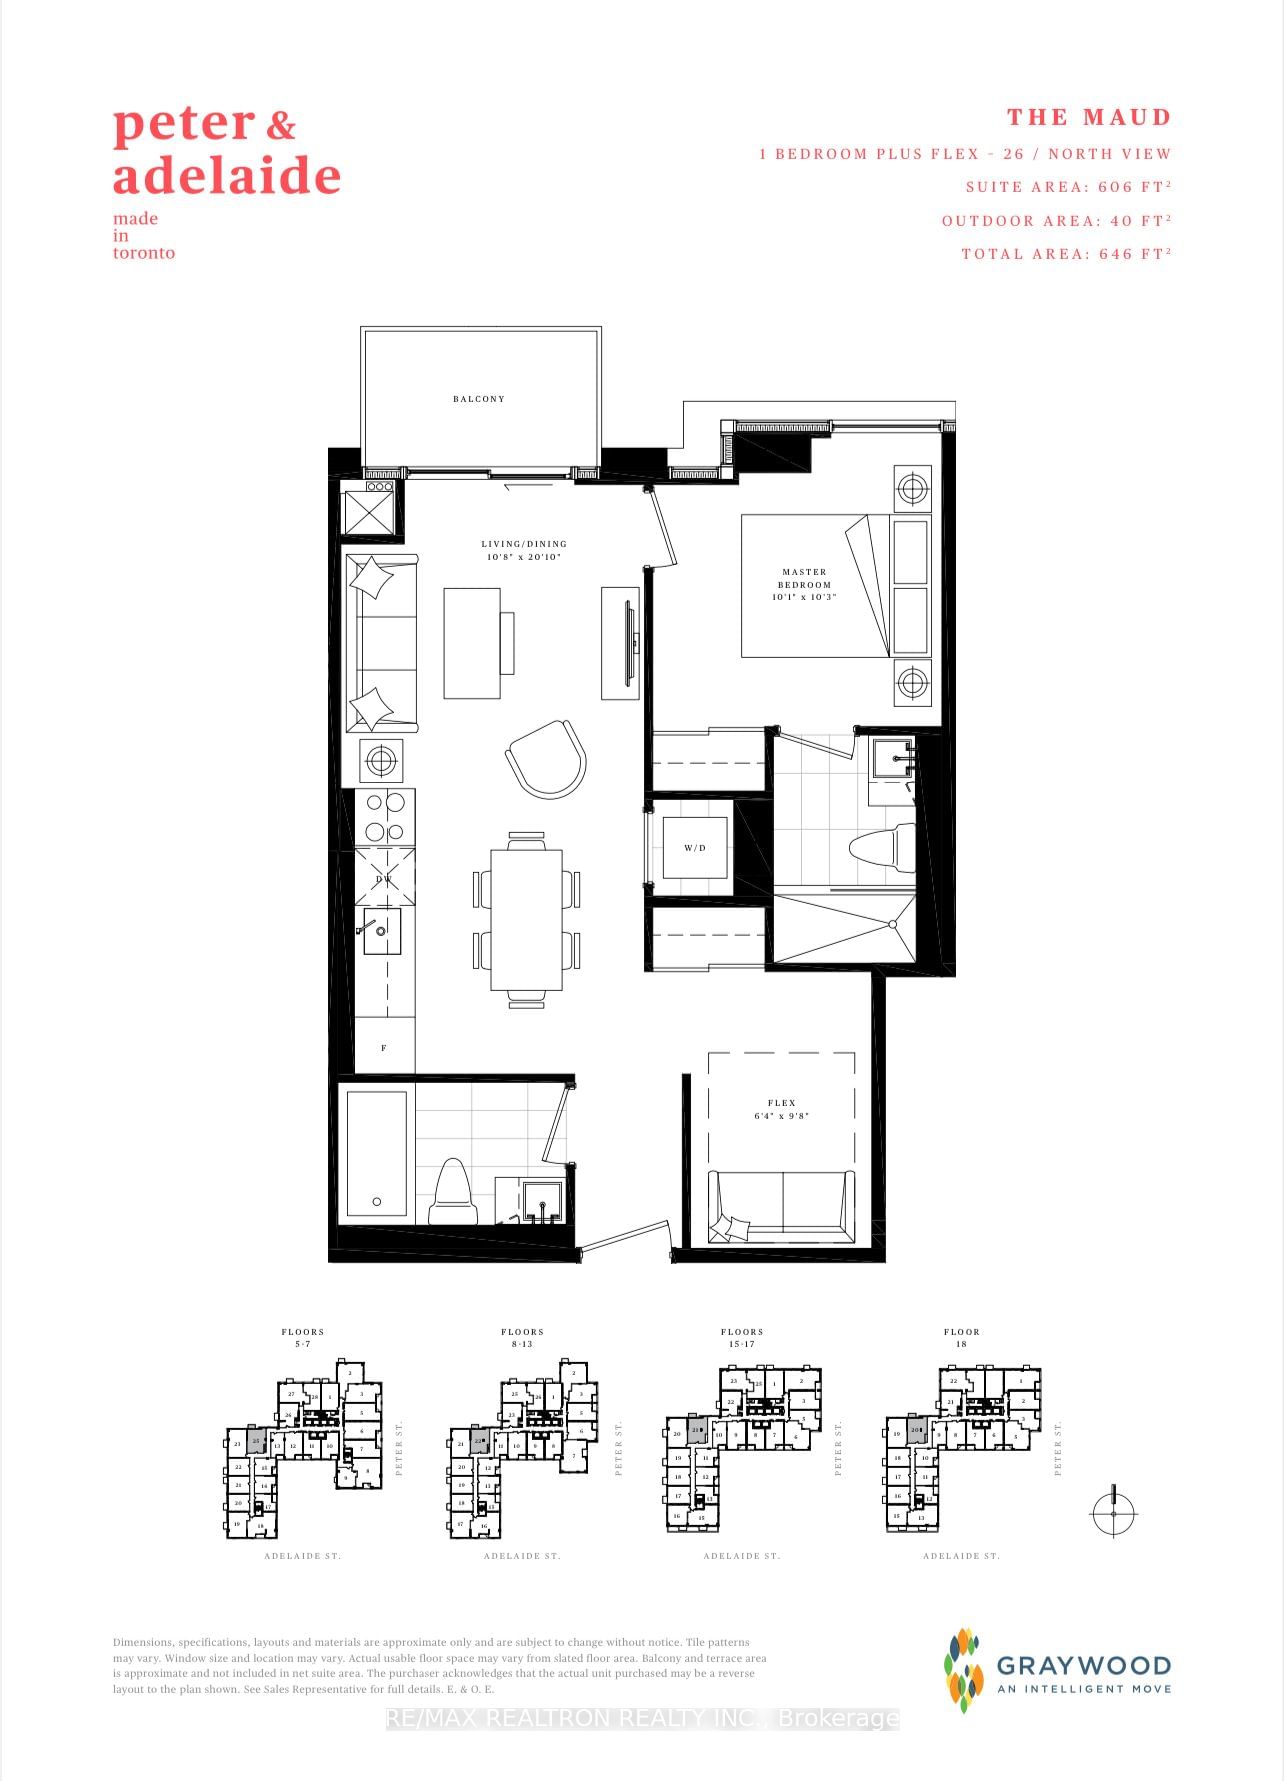
Room Dimensions
About this Listing
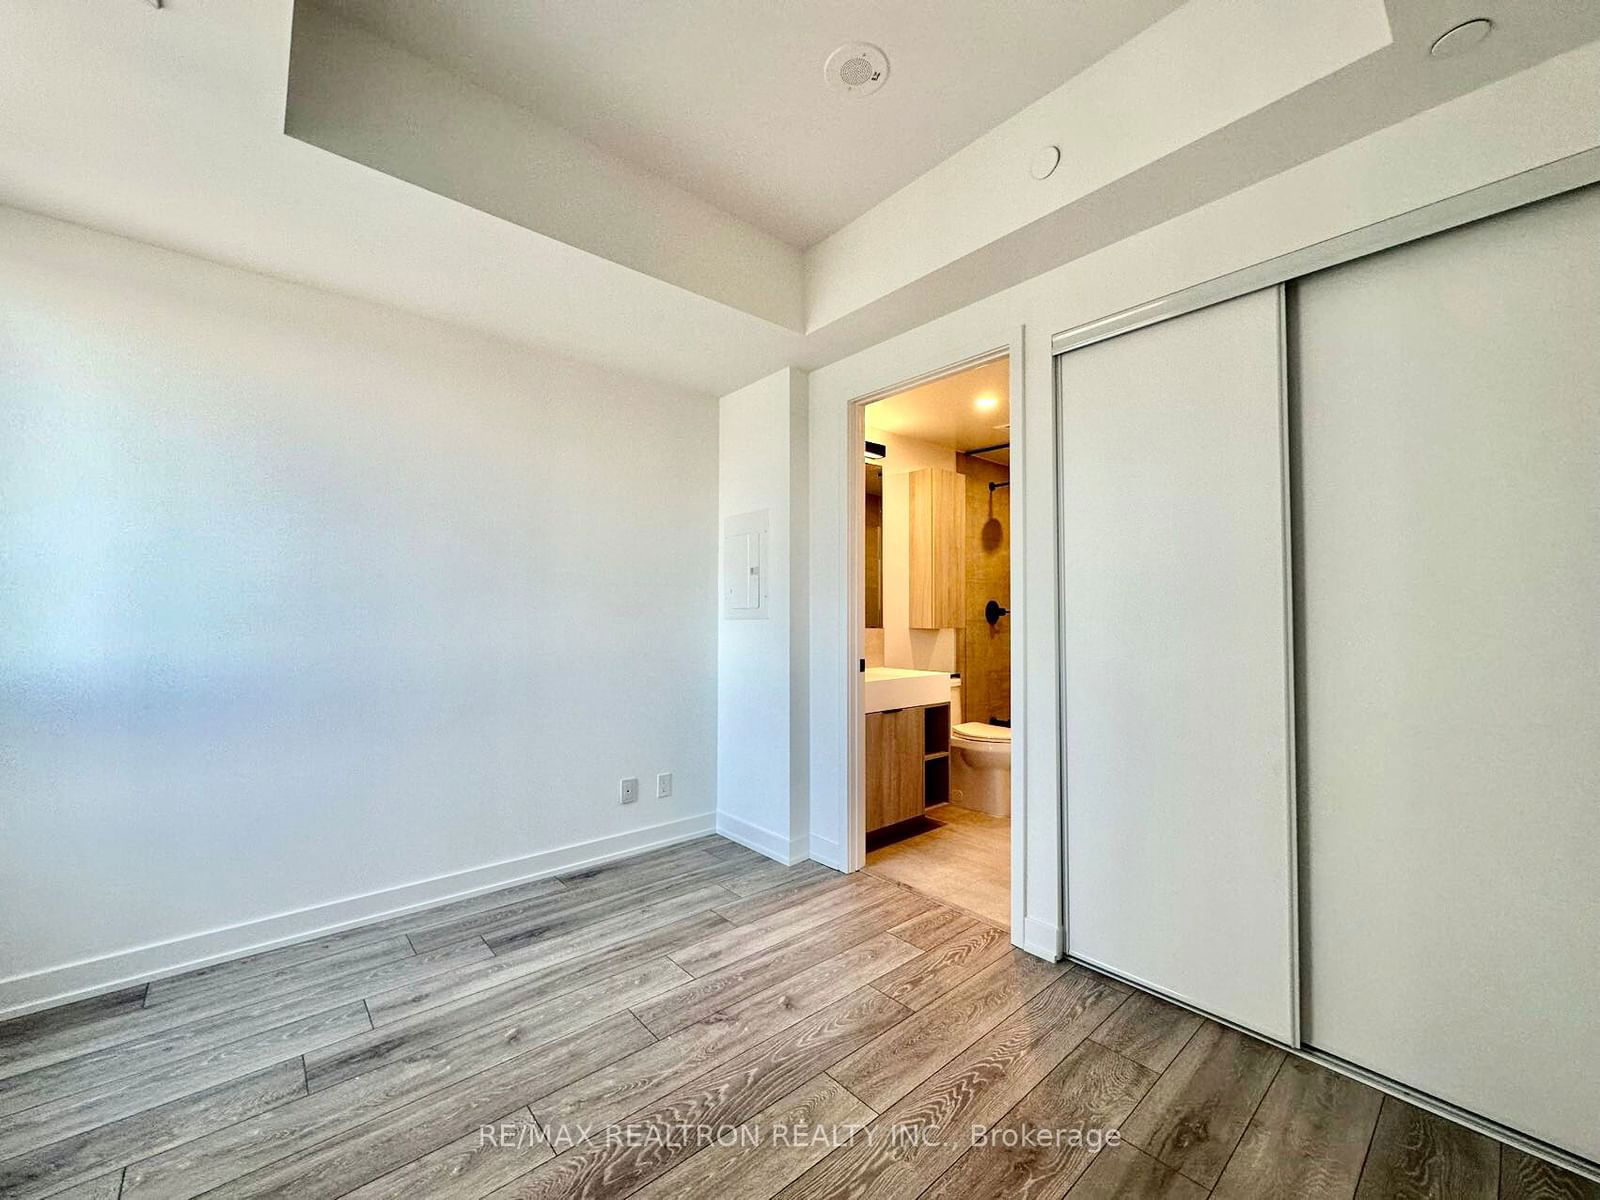
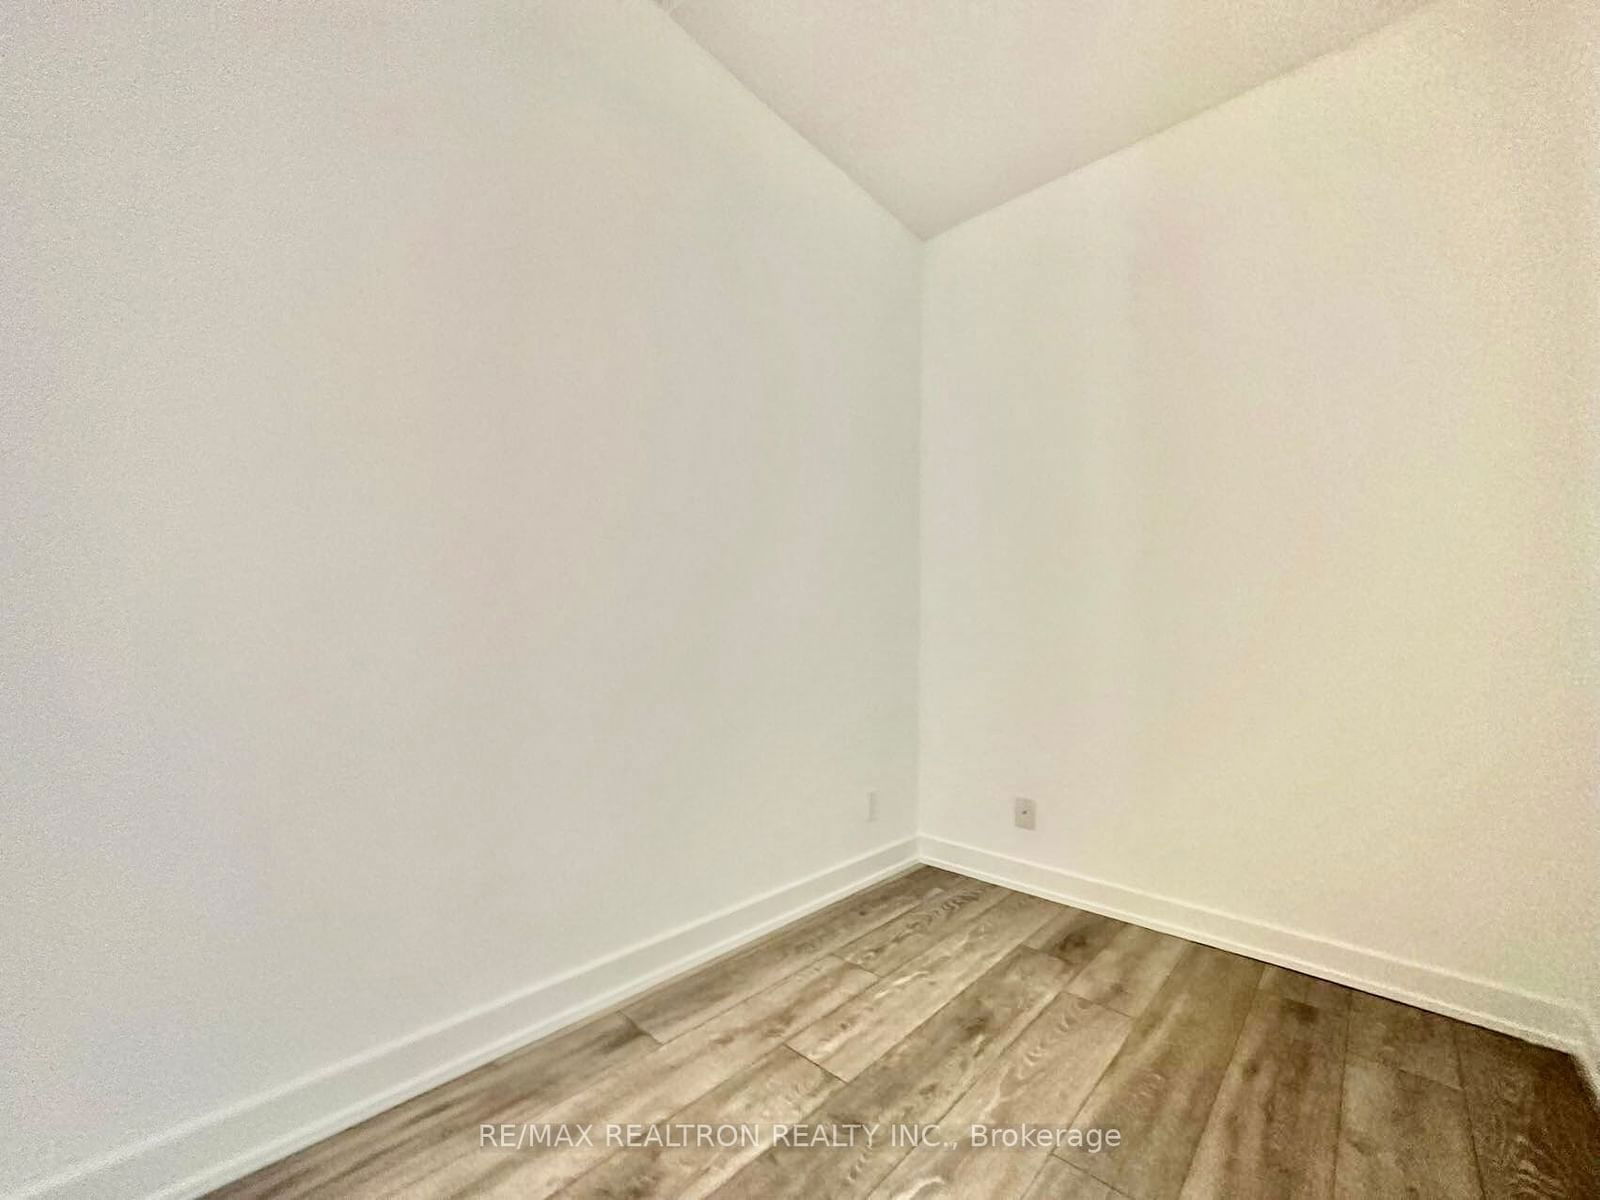
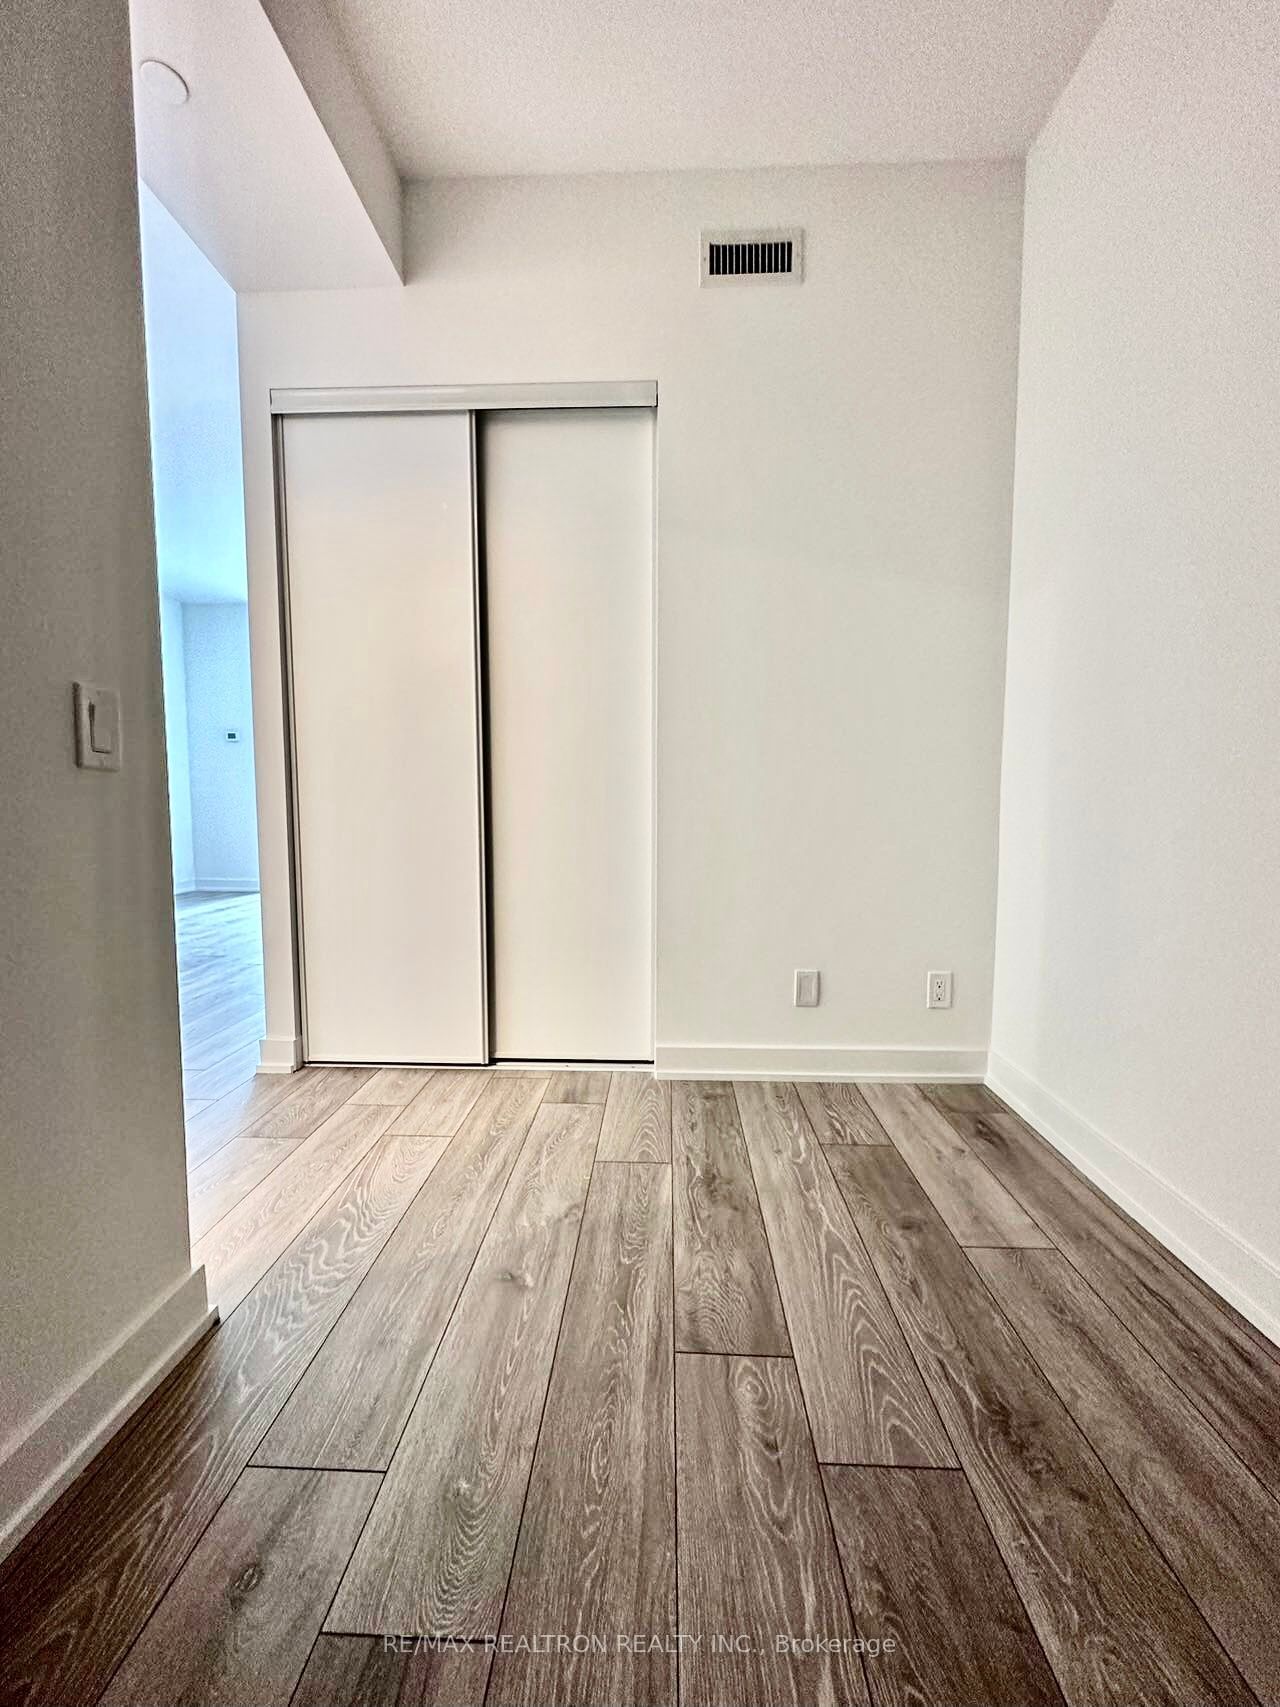
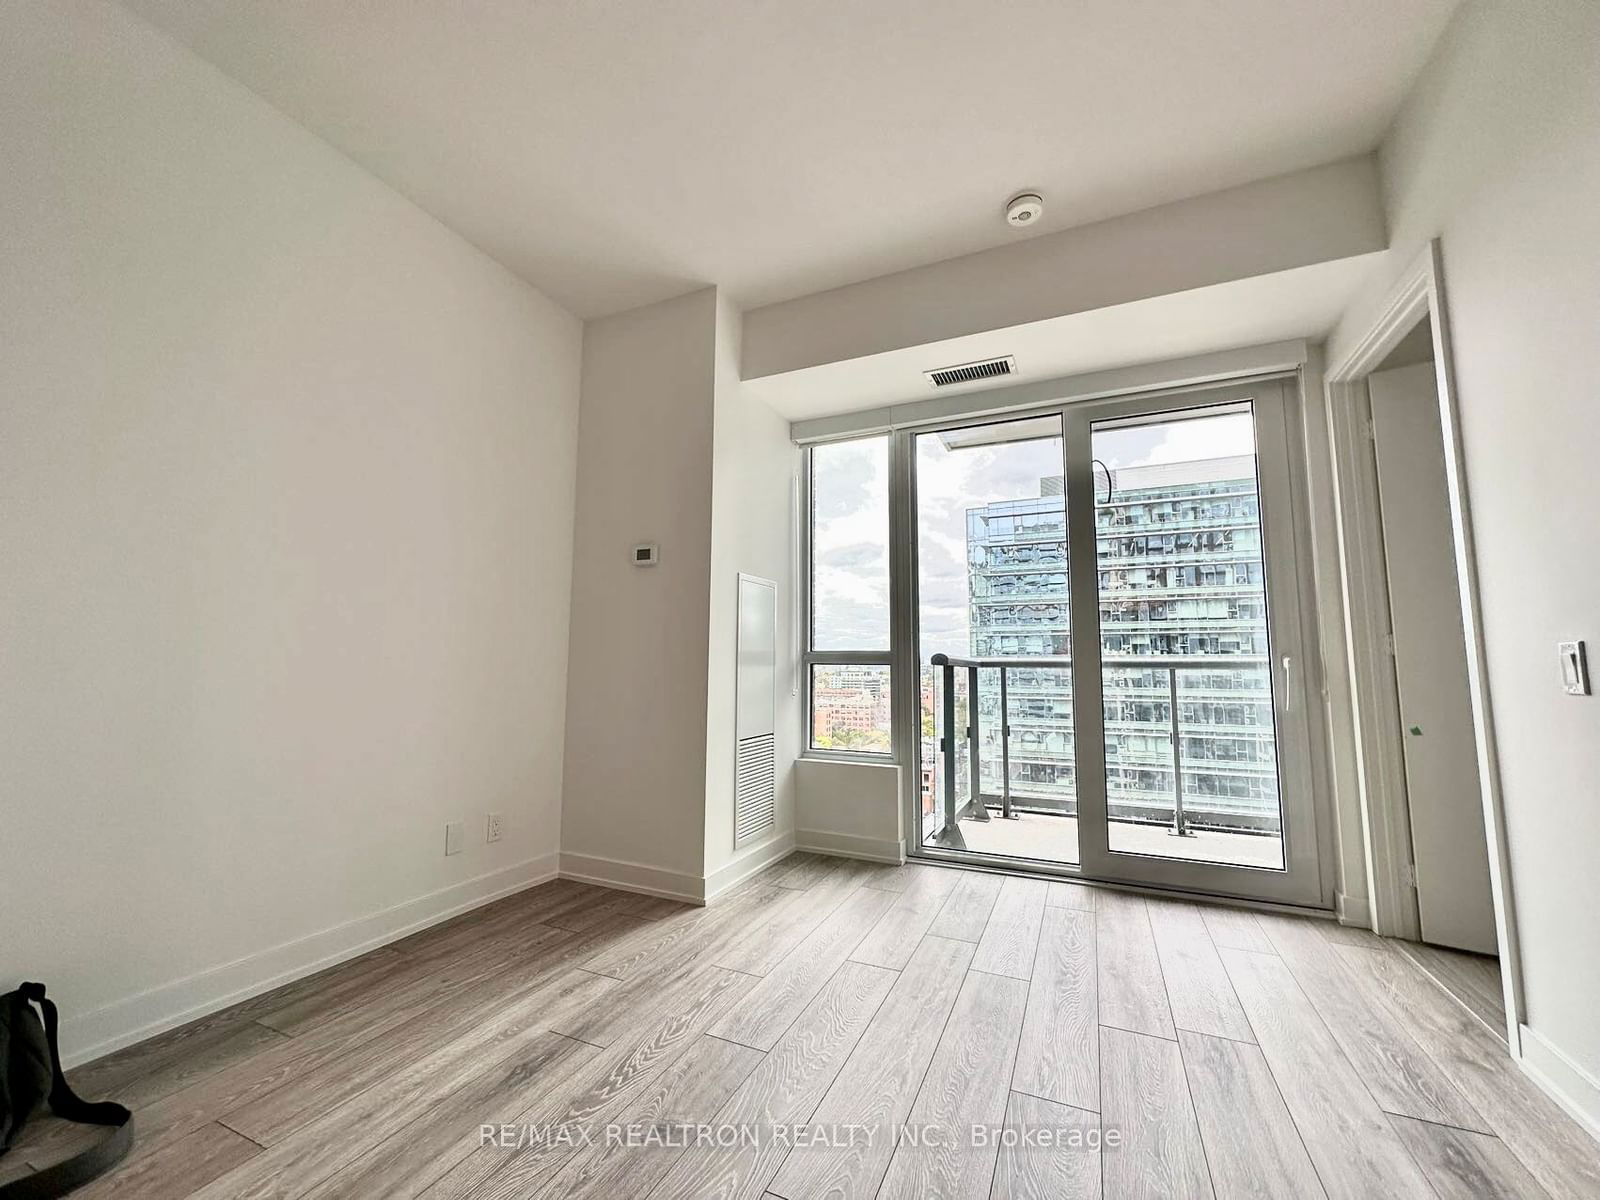
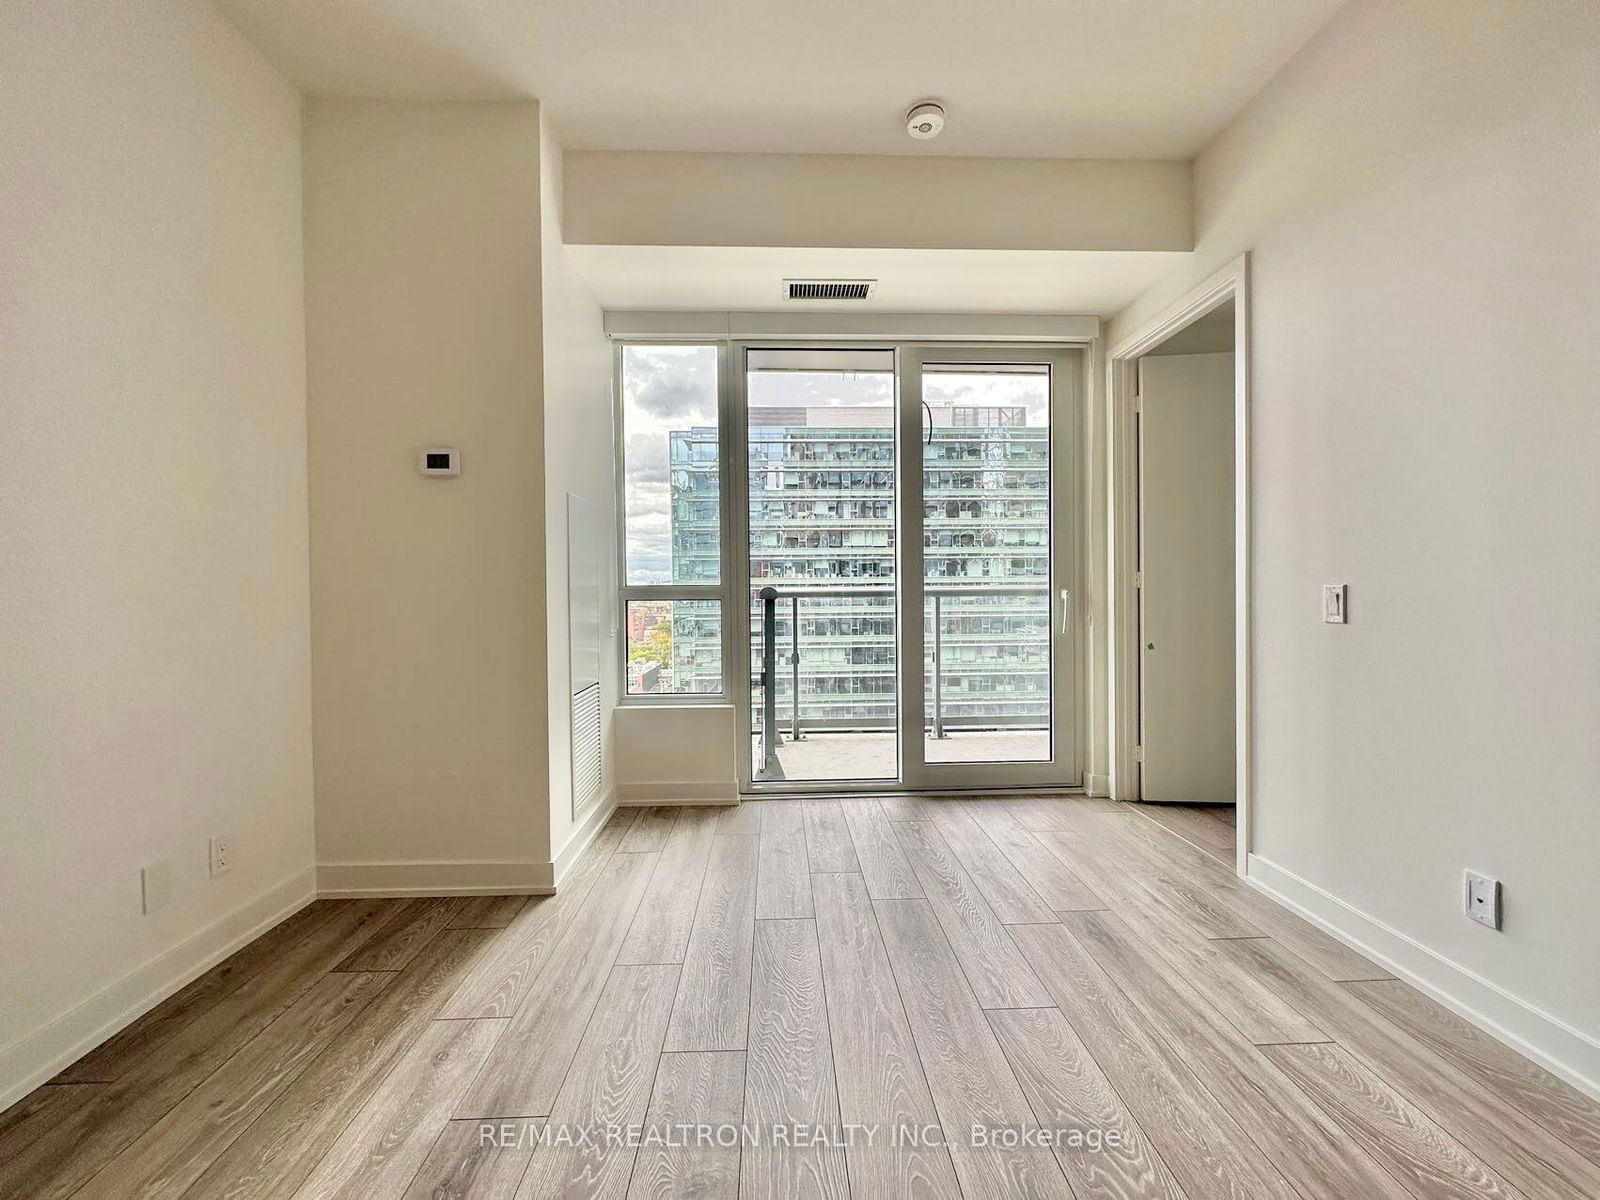
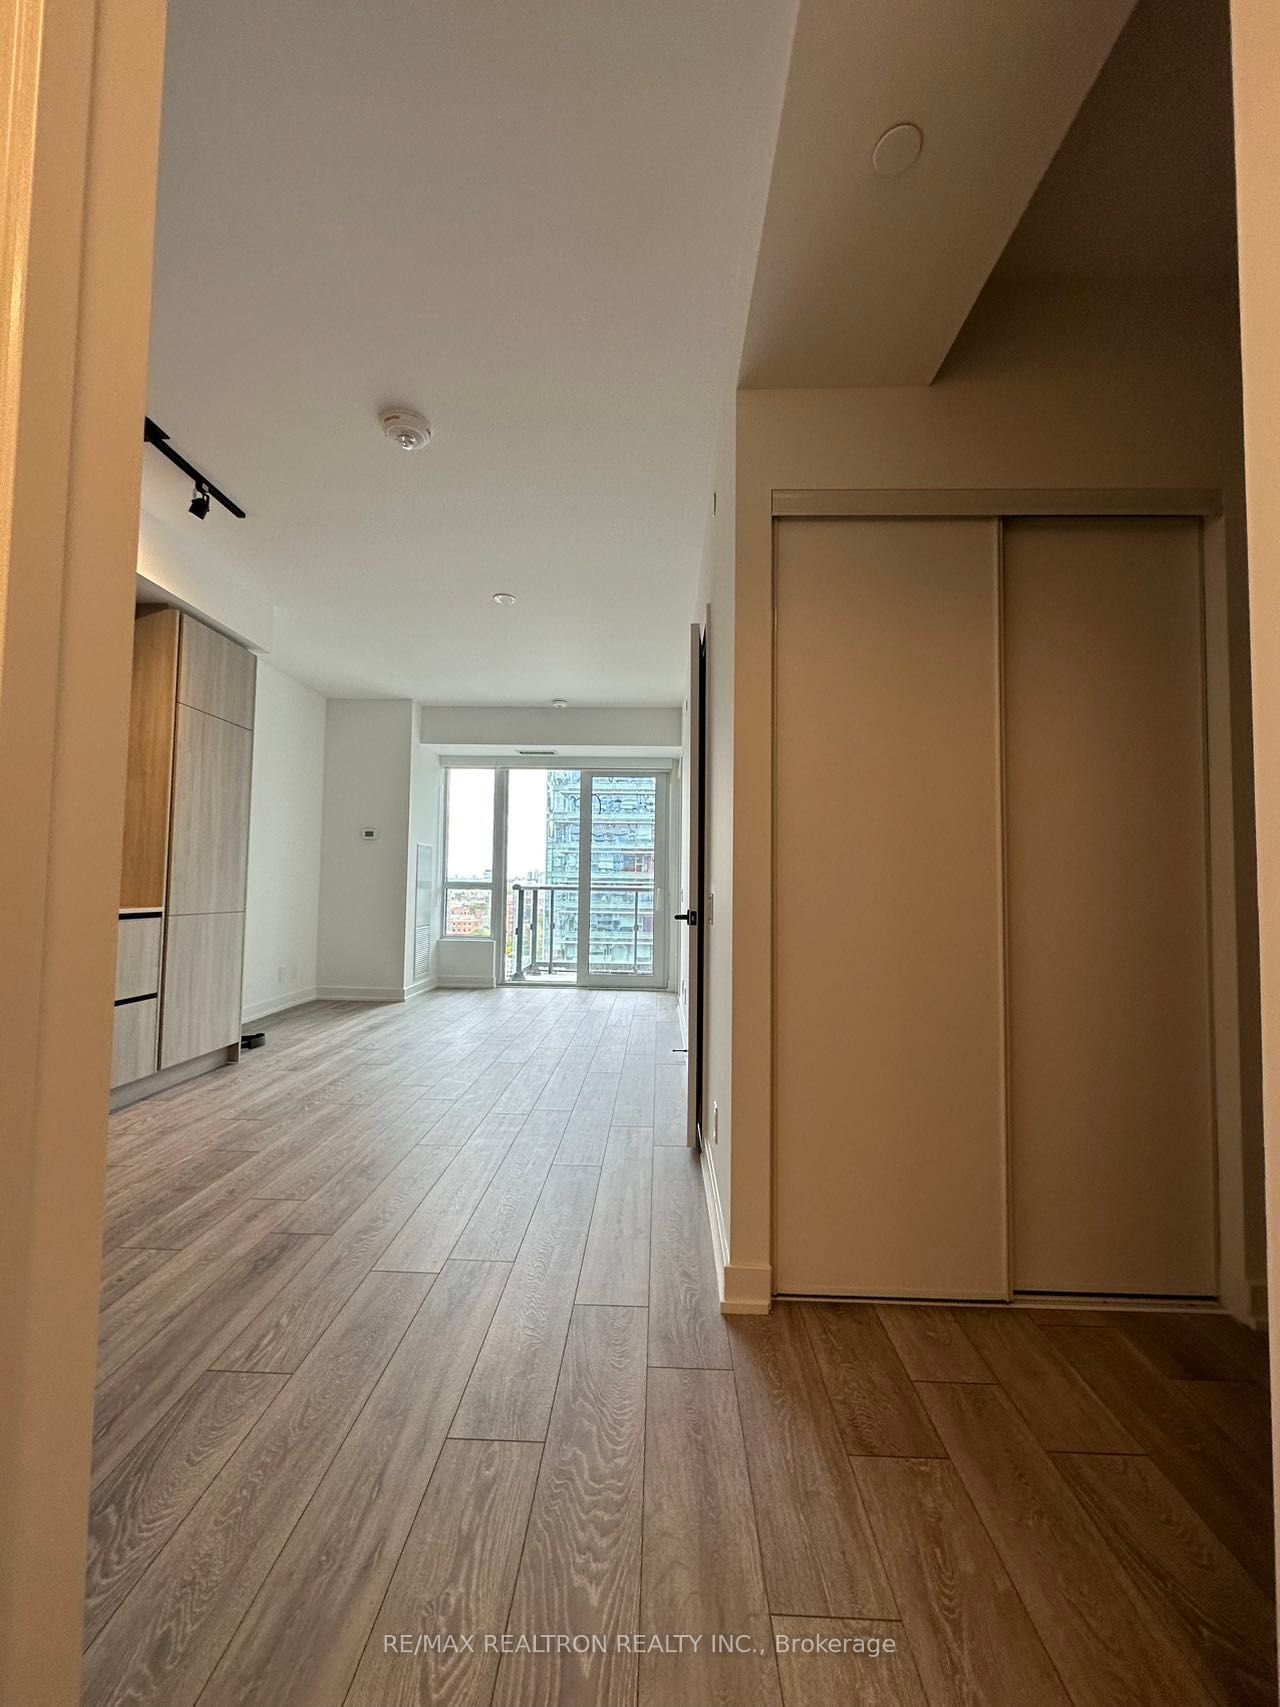
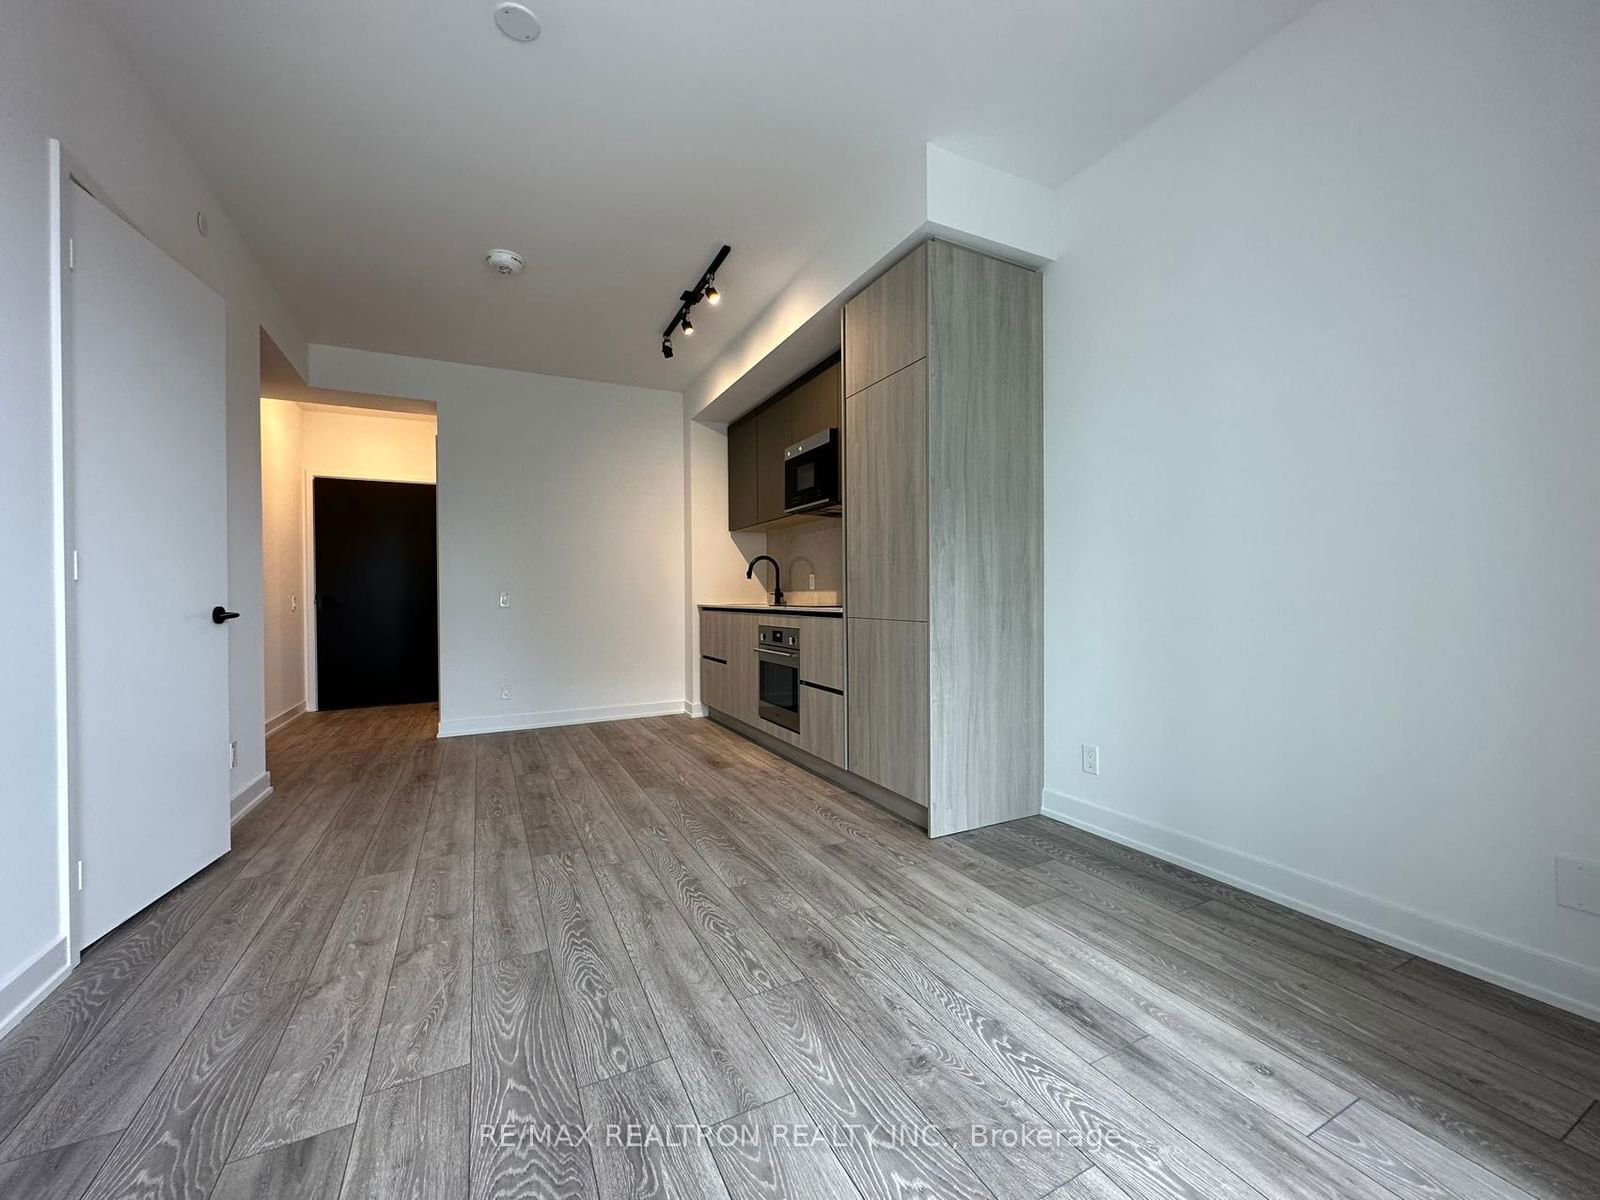
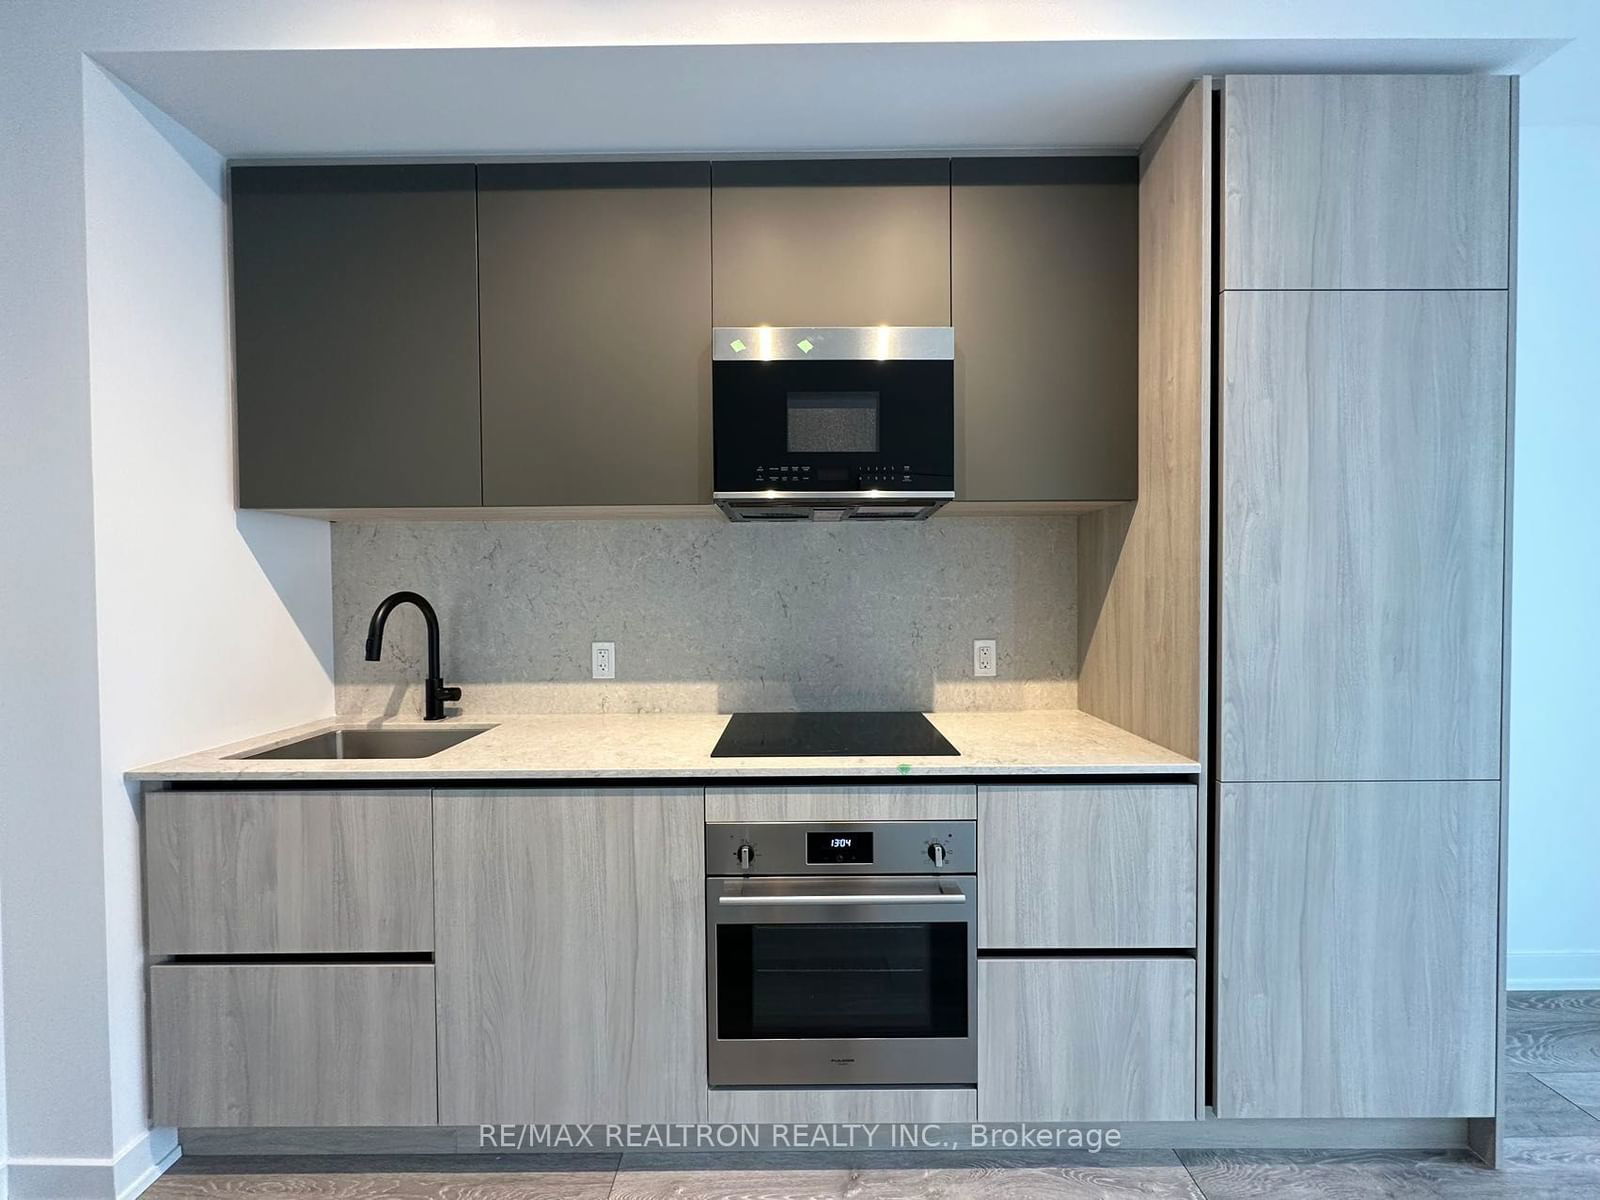
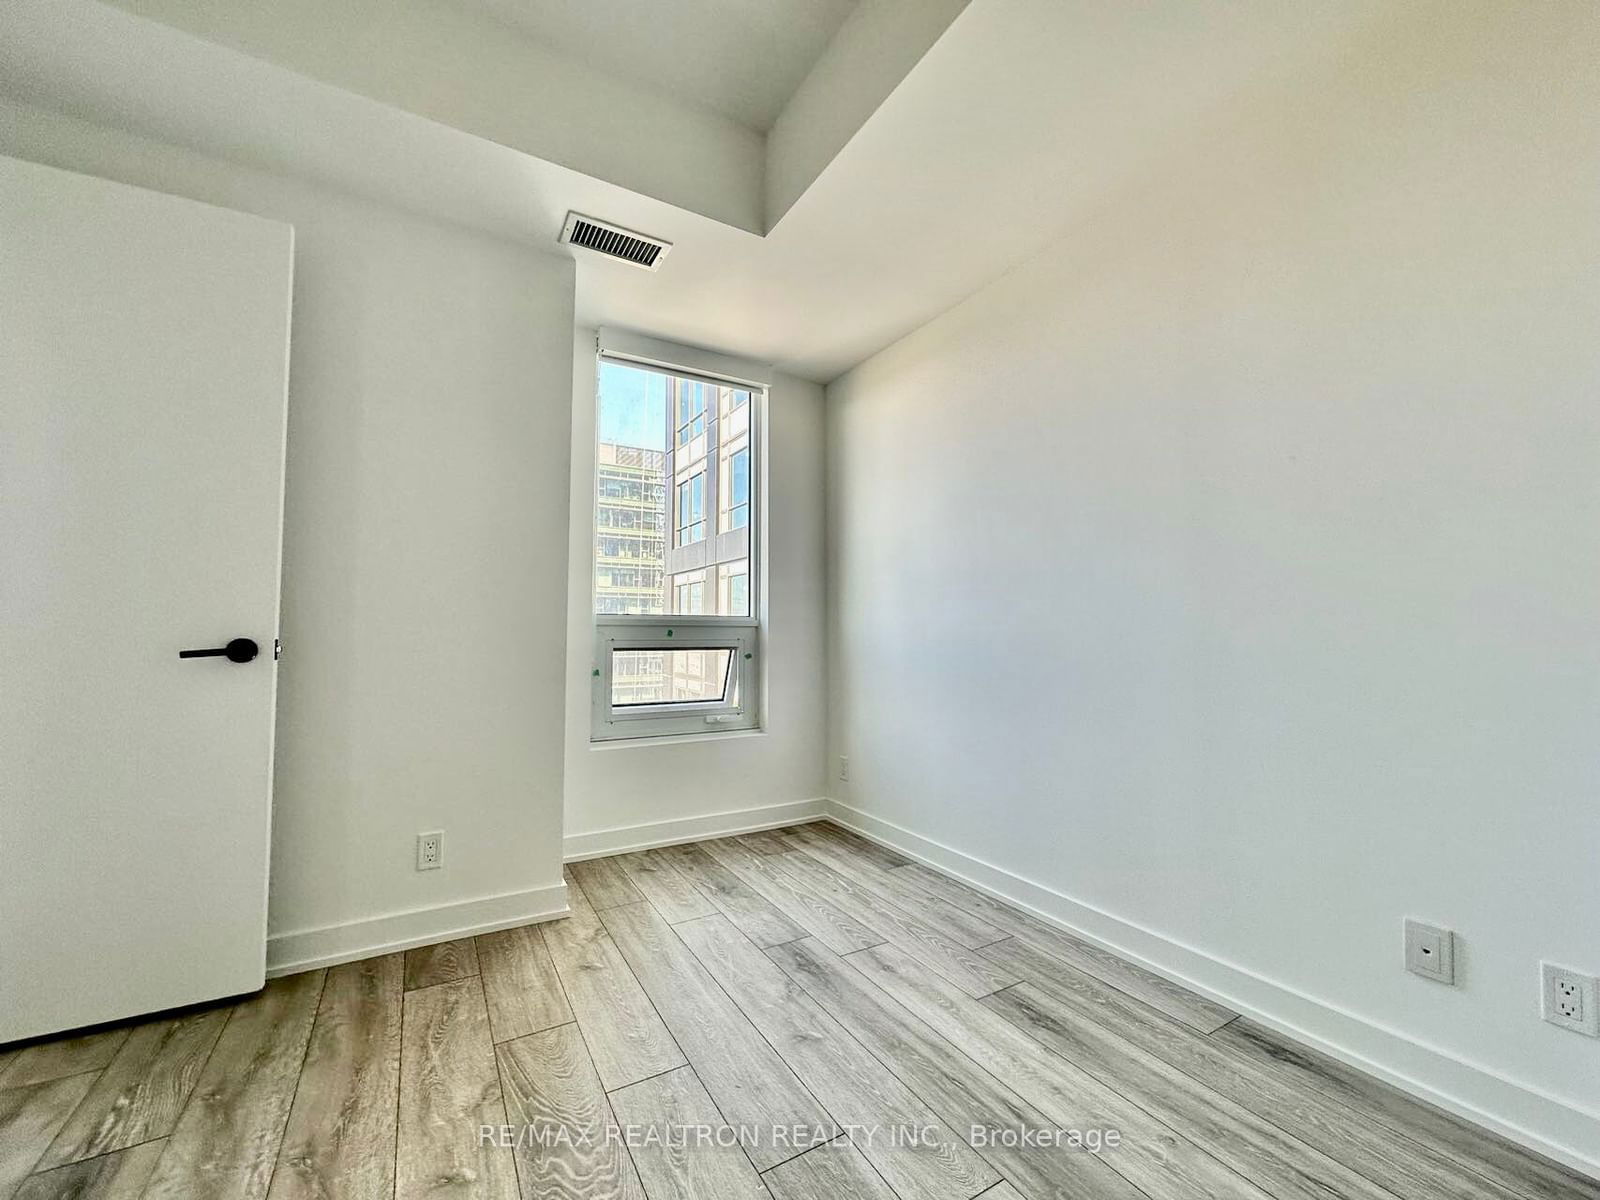
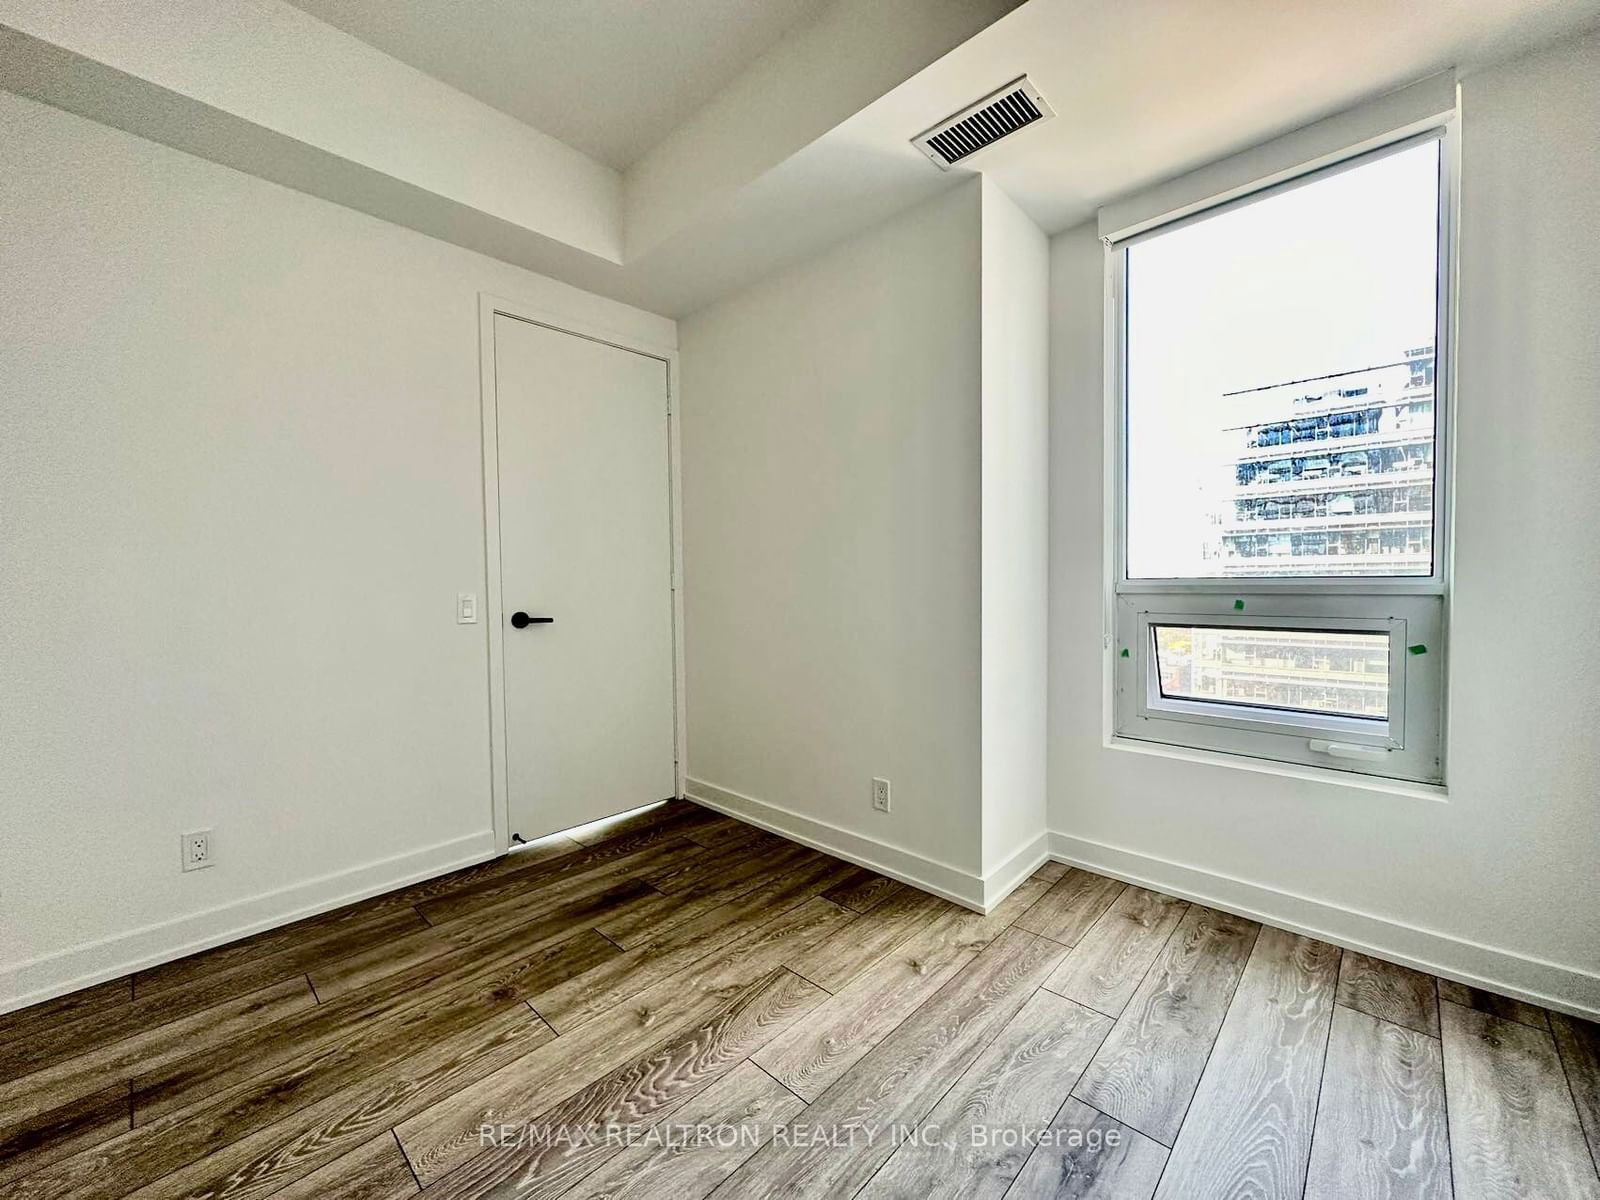
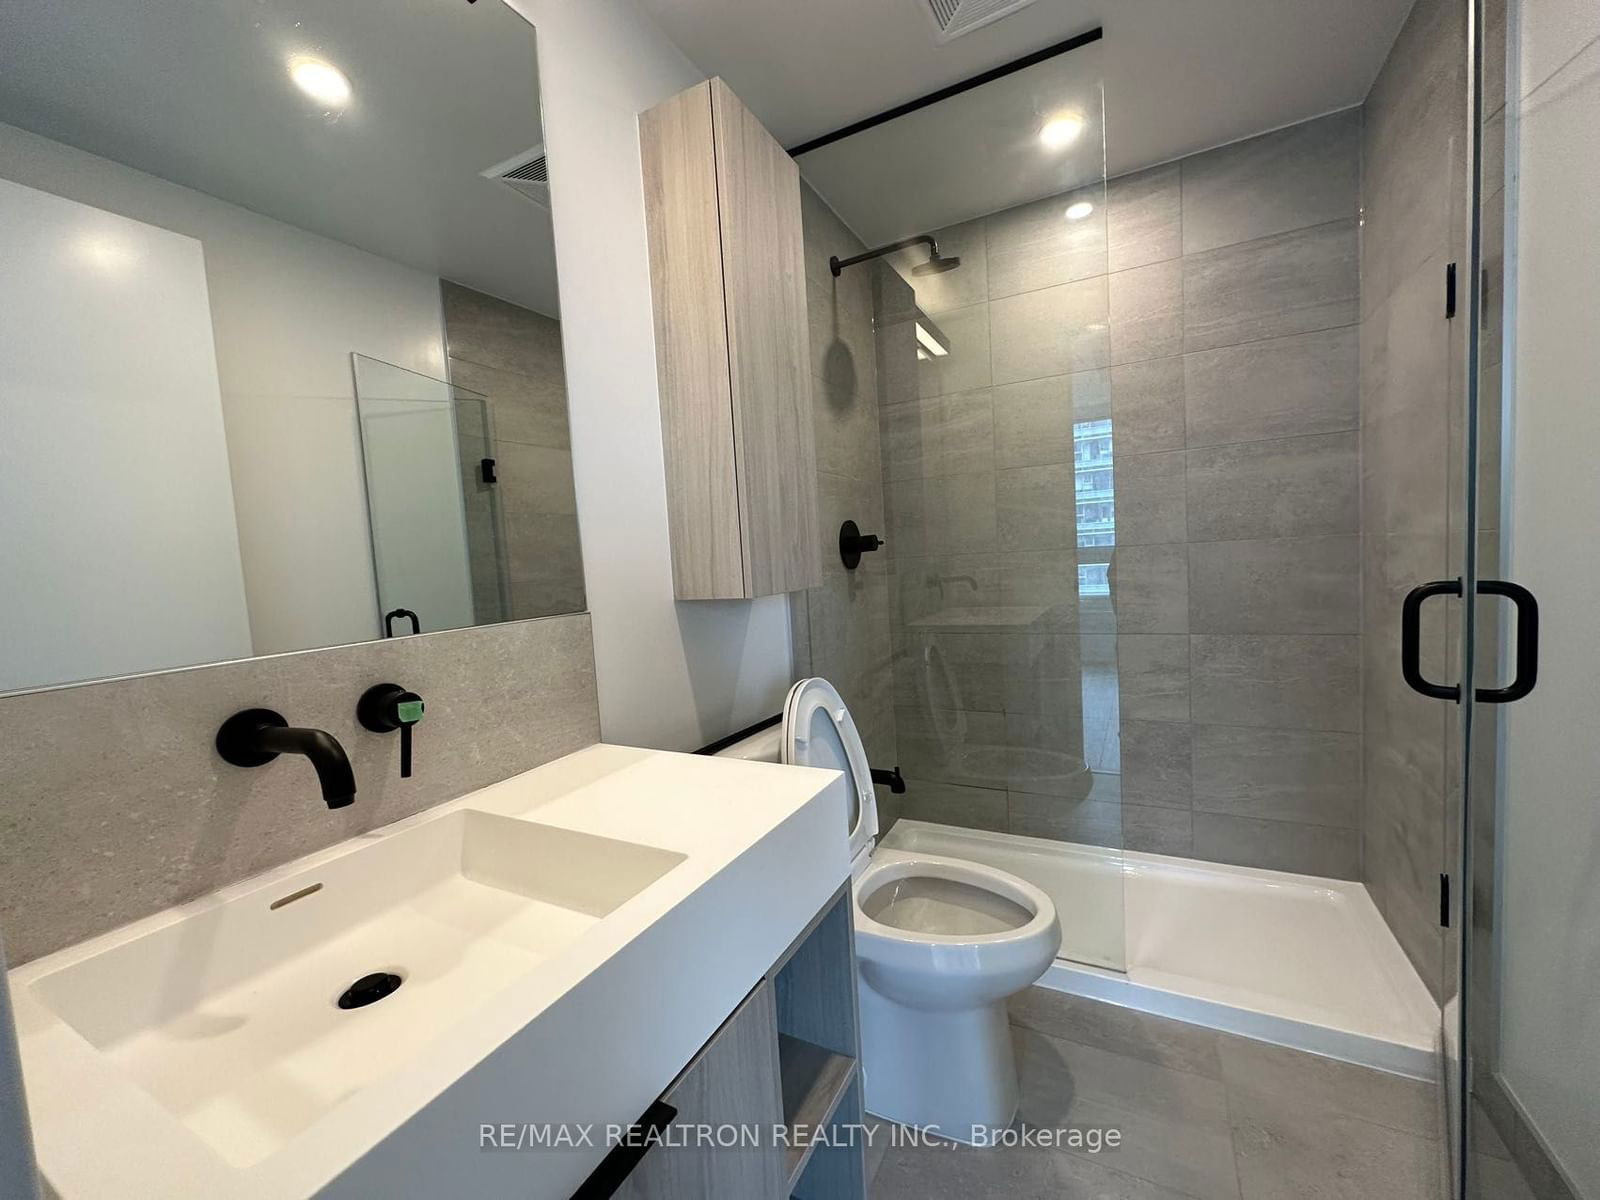
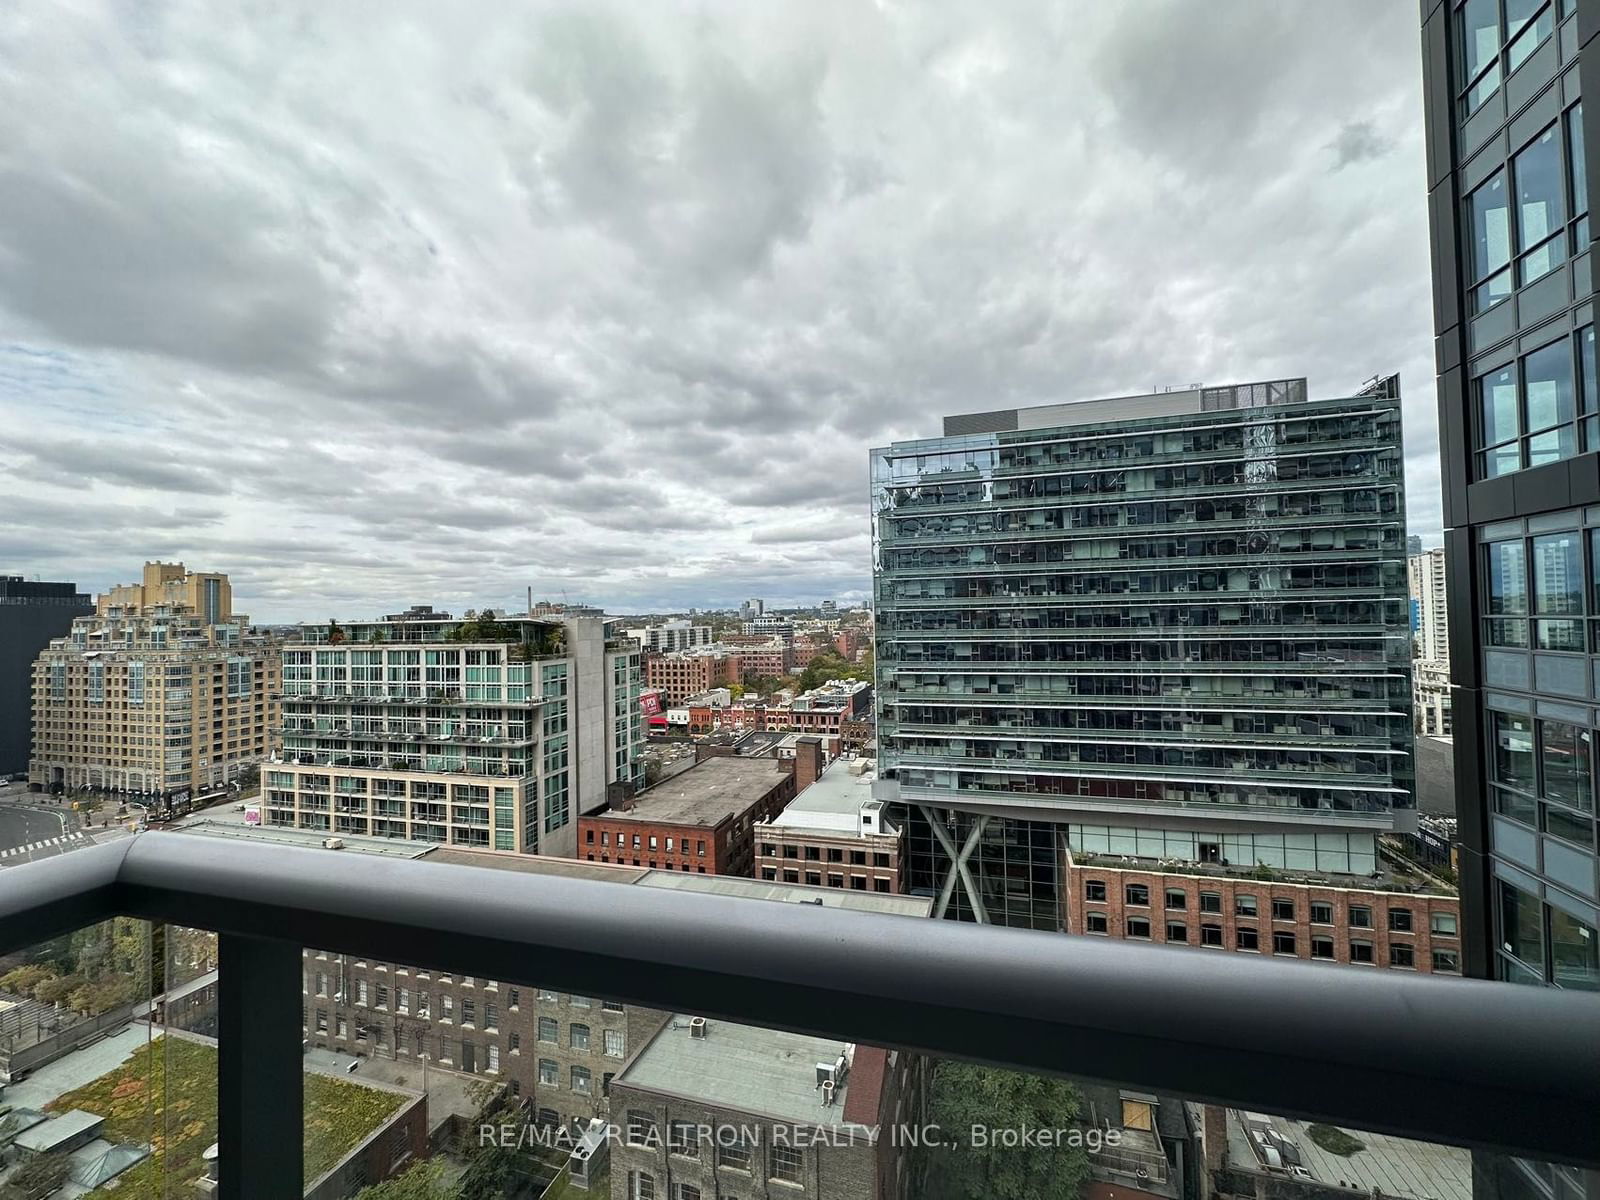
This Brand New 1 Bedroom + Den Suite At Peter and Adelaide Condos. One of the Best Floorplans In the Building This Layout Has A Den Large Enough To Use As a Second Bedroom and Has 2 Full Bathrooms! Lots of Amenities & Beautiful Rooftop Outdoor Pool With Loungers. Located in Toronto's Harbor front and Entertainment Districts, Minutes from Financial and Entertainment Areas. This Location is a Walker's Paradise (Walk Score of 100!) So Daily Errands Do Not Require A Car. Walk to Attractions Like CN Tower, Rogers Centre, TTC & Subway, Shopping, Clubs, Restaurants and More! See attached Floor Plans and Photos. A Must See.
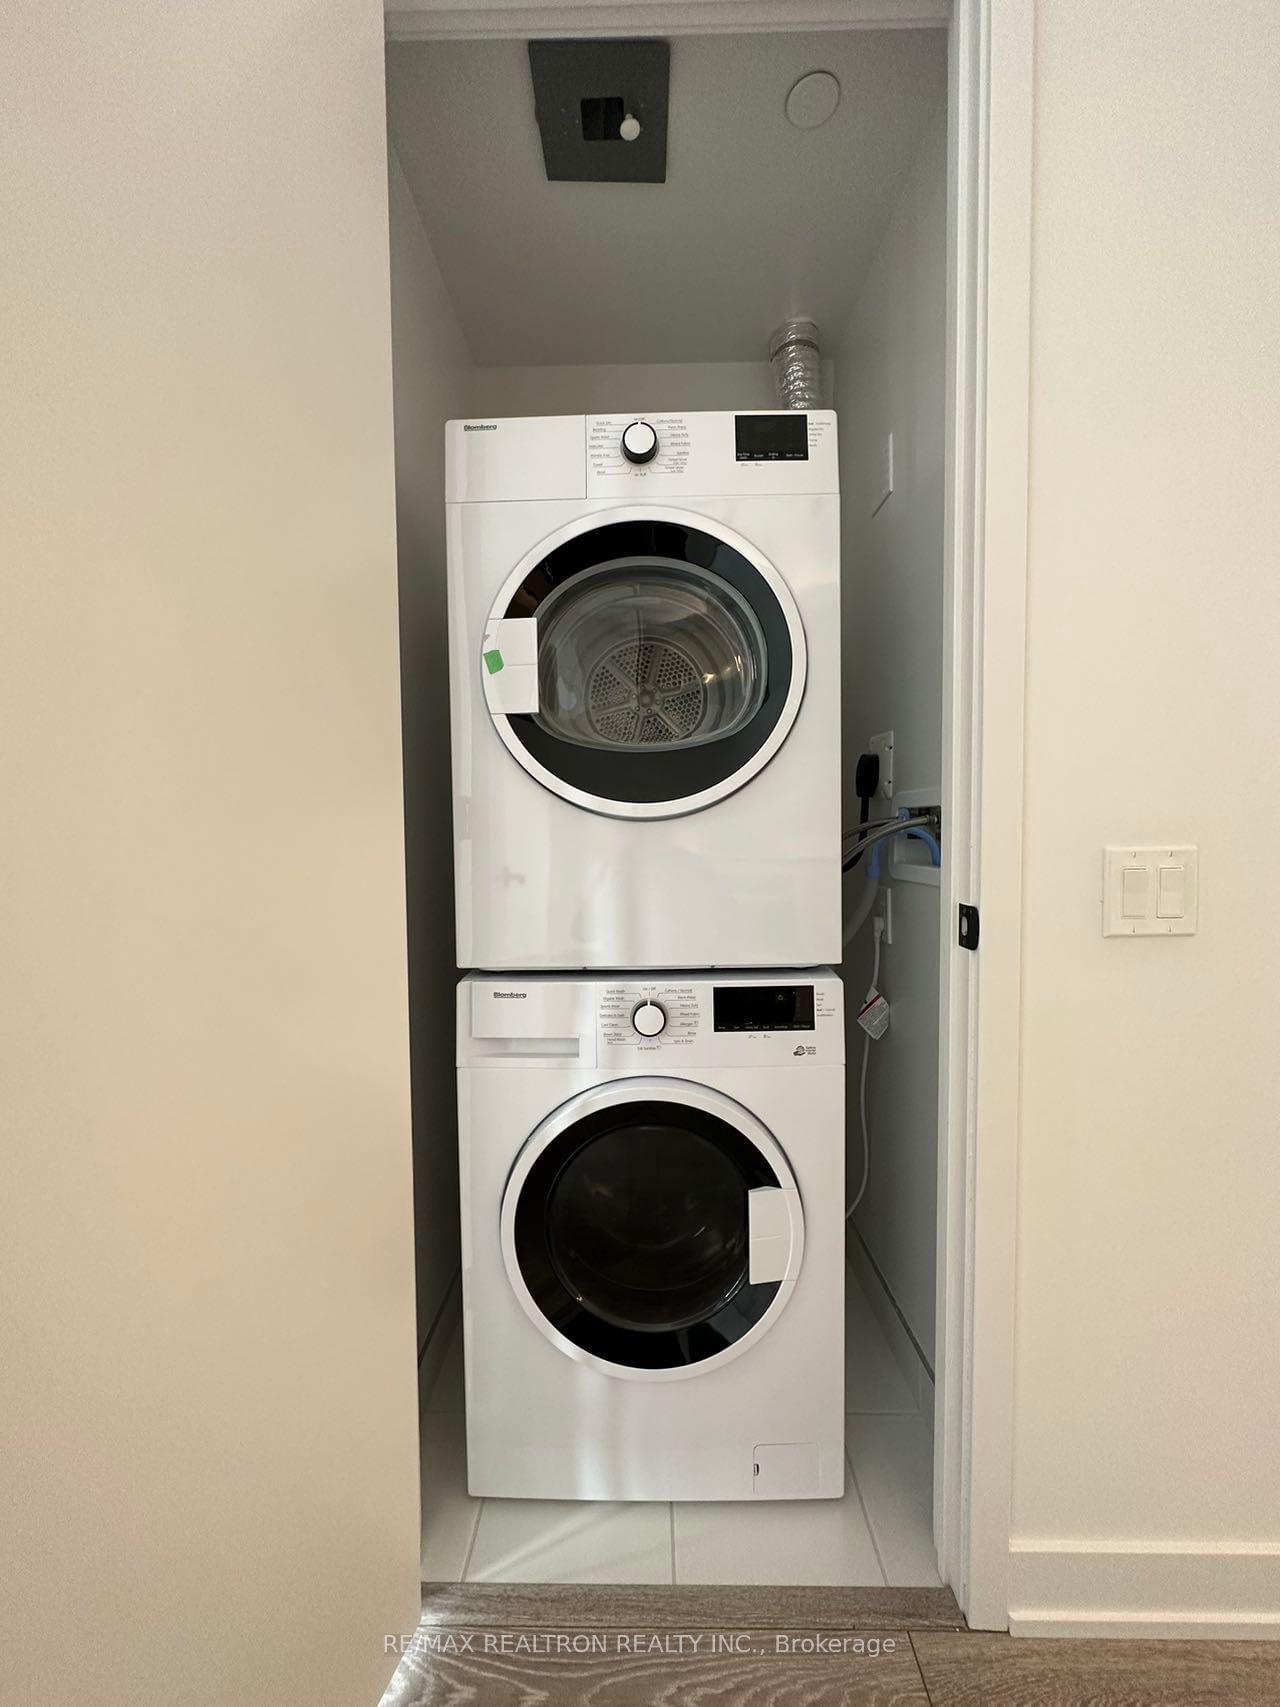
ExtrasNew Integrated Kitchen Appliances (Stove, Fridge, Dishwasher, B/I Microwave) Stackable Washer & Dryer
re/max realtron realty inc.MLS® #C10413894
Amenities
Explore Neighbourhood
Similar Listings
Demographics
Based on the dissemination area as defined by Statistics Canada. A dissemination area contains, on average, approximately 200 – 400 households.
Price Trends
Maintenance Fees
Building Trends At Peter & Adelaide Condos
Days on Strata
List vs Selling Price
Offer Competition
Turnover of Units
Property Value
Price Ranking
Sold Units
Rented Units
Best Value Rank
Appreciation Rank
Rental Yield
High Demand
Transaction Insights at 350 Adelaide Street W
| Studio | 1 Bed | 1 Bed + Den | 2 Bed | 2 Bed + Den | 3 Bed | 3 Bed + Den | |
|---|---|---|---|---|---|---|---|
| Price Range | No Data | $485,000 - $635,000 | $590,000 - $770,000 | $720,000 - $1,070,000 | $893,000 | $875,000 - $1,340,000 | No Data |
| Avg. Cost Per Sqft | No Data | $1,250 | $1,221 | $1,179 | $1,298 | $1,192 | No Data |
| Price Range | No Data | $1,500 - $2,700 | $2,250 - $3,200 | $1,380 - $3,500 | $2,950 - $3,700 | $1,350 - $5,450 | No Data |
| Avg. Wait for Unit Availability | No Data | 46 Days | 34 Days | 51 Days | No Data | 87 Days | No Data |
| Avg. Wait for Unit Availability | 22 Days | 5 Days | 3 Days | 3 Days | 11 Days | 10 Days | No Data |
| Ratio of Units in Building | 1% | 20% | 33% | 31% | 7% | 10% | 1% |
Transactions vs Inventory
Total number of units listed and leased in Queen West
