2302 - 228 Queens Quay W


1 / 30
For RentThe RivieraEst Lease Timeframe 28 Days
$3,600/mth
2 Beds
2 Bath
1 Parking
905 SQFT
43 Days on Strata
Listing History
Unit Highlights
Possession Date:
October 1, 2024
Lease Term:
Short Term
Property Type:
Condo
Utilities Included:
Yes
Outdoor Space:
Balcony
Furnished:
Yes
Exposure:
North East
Locker:
None
Laundry:
Ensuite
Renter's Market
Balanced
Landlord's Market
Utilities Included
Rent Includes
Hydro
Heat
Air Conditioning
Water
Parking
Building Maintenance
Excluded
None
Utility Type
- Air Conditioning
- Central Air
- Heat Source
- Electric
- Heating
- Heat Pump
Room Dimensions
Foyer
Large Window, Ceramic Floor, Closet
8.24 x 6.4ft
Living
Windows Floor to Ceiling, Hardwood Floor, Overlooks Water
18.64 x 14.93ft
Dining
Windows Floor to Ceiling, Hardwood Floor, Overlooks Water
18.64 x 14.93ft
About this Listing
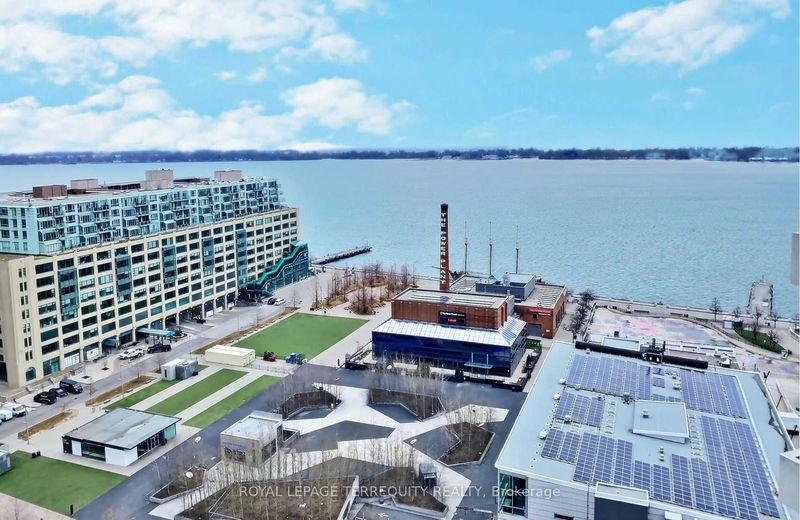
Short Term (6 to 8 months) Furnished Rental. Stunning Views-Lake Ontario, Marina, Island Airport, City Skyline, C.N.Tower, Rogers Centre, Ripley's Aquarium, Steam Whistle Park. Balcony & Living/Dining Rms Give 270 Degree View Of The Best Of Toronto! 905 Sq Ft 2 Bed 2 Bath, Balcony Faces Se. Cross The Street To Harbourfront Centre 10 Acre Family Event Venue, TTC To Union/Spadina/Exhibition Out Front. Walk Everywhere - Bike Path On QQ
royal lepage terrequity realtyMLS® #C9250650
Amenities
Gym Room
Party Room
Rooftop Deck
Indoor Pool
Guest Suites
Concierge
Explore Neighbourhood
9/10
Walkability
One small step for you. One giant leap towards never needing a gym membership.
10/10
Transit
Meet the heartbeat of the city — transit so smooth, you’ll never miss a beat.
7/10
Bikeability
The bike lane starts to feel like a second home.
Similar Listings
Demographics
Based on the dissemination area as defined by Statistics Canada. A dissemination area contains, on average, approximately 200 – 400 households.
Population
17,591
Average Individual Income
$62,082
Average Household Size
3 persons
Average Age
45
Average Household Income
$105,756
Dominant Housing Type
Detached
Population By Age
Household Income
Housing Types & Tenancy
Detached
39%
High Rise Apartment
23%
Semi Detached
21%
Low Rise Apartment
9%
Duplex
4%
Marital Status
Commute
Languages (Primary Language)
Other
70%
Mandarin
13%
Cantonese
10%
Tagalog
2%
Tamil
2%
Arabic
1%
Spanish
1%
Armenian
1%
Education
University and Above
36%
High School
24%
None
16%
College
15%
Apprenticeship
3%
University Below Batchelor
3%
Major Field of Study
Business Management
26%
Architecture & Engineering
20%
Health & Related Fields
11%
Social Sciences
11%
Math & Computer Sciences
7%
Humanities
5%
Physical Sciences
5%
Education
4%
Visual & Performing Arts
3%
Personal, Protective & Transportation Services
2%
Price Trends
Maintenance Fees
The Riviera vs The Waterfront Area
Building Trends At The Riviera
Days on Strata
Units at The Riviera spend an average of
22
Days on Strata
based on recent sales
List vs Selling Price
On average, these condos sell for
1%
below
the list price.
Offer Competition
Condos in this building have an
AVERAGEchance of receiving
Multiple Offers
compared to other buildings in The Waterfront
Turnover of Units
On average, each unit is owned for
6.4
YEARS before being sold againProperty Value
4%
Increase in property value within the past twelve months
Price Ranking
8th
Highest price per SQFT out of 41 condos in The Waterfront area
Sold Units
8
Units were Sold over the past twelve months
Rented Units
56
Units were Rented over the past twelve months
Best Value Rank
The Riviera offers the best value out of 41 condos in neighbourhood
?
Appreciation Rank
The Riviera has the highest ROI out of 41 condos in neighbourhood
?
Rental Yield
The Riviera yields the highest rent prices out of 41 condos in neighbourhood
?
High Demand
The Riviera is the most popular building out of 41 condos in neighbourhood
?
Transaction Insights at 228 Queens Quay W
| Studio | 1 Bed | 1 Bed + Den | 2 Bed | 2 Bed + Den | 3 Bed | |
|---|---|---|---|---|---|---|
| Price Range | No Data | $528,000 - $650,000 | No Data | No Data | $1,175,000 | No Data |
| Avg. Cost Per Sqft | No Data | $1,067 | No Data | No Data | $1,290 | No Data |
| Price Range | No Data | $2,250 - $3,200 | $2,400 - $3,000 | $3,200 - $4,100 | $3,600 - $3,900 | $5,200 |
| Avg. Wait for Unit Availability | No Data | 37 Days | 141 Days | 56 Days | 129 Days | No Data |
| Avg. Wait for Unit Availability | No Data | 15 Days | 80 Days | 26 Days | 73 Days | 620 Days |
| Ratio of Units in Building | 2% | 50% | 14% | 26% | 11% | 1% |
Transactions vs Inventory
Total number of units listed and leased in Waterfront
