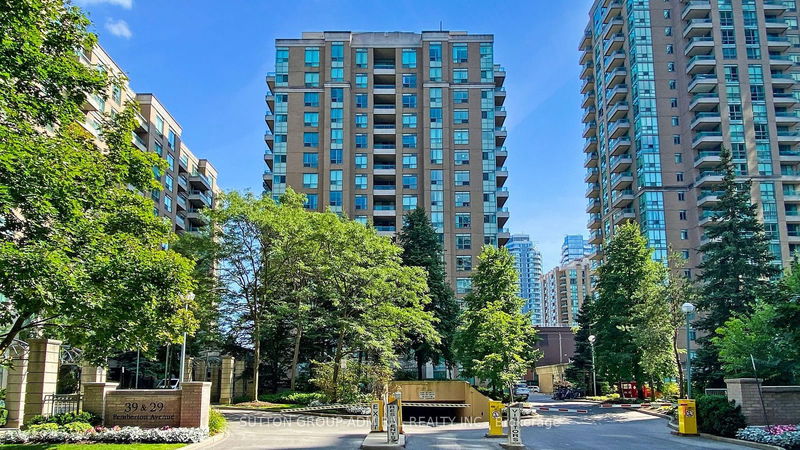
508 - 39 Pemberton Ave E


1 / 17
For SaleThe Paramount CondosEst Sell Timeframe 9 Days
$588,000
2 Beds + 1
2 Bath
1 Parking
980 SQFT
16 Days on Strata
Listing History
Unit Highlights
Property Type:
Condo
Maintenance Fees:
$940/mth
Taxes:
$2,790 (2023)
Cost Per Sqft:
$600/sqft
Locker:
Owned
Outdoor Space:
Balcony
Exposure:
East
Possession Date:
September 30, 2024
Laundry:
Main
Buyer's Market
Balanced
Seller's Market
Maintenance Fees
Included
Hydro
Heat
Water
Parking
Building Maintenance
Building Insurance
Excluded
Air Conditioning
Utility Type
- Air Conditioning
- Central Air
- Heat Source
- Gas
- Heating
- Forced Air
Room Dimensions
Living
Combined with Dining, Laminate
17 x 10.14ft
Dining
Combined with Living, Laminate
17 x 10.14ft
Prim Bdrm
Laminate, Closet, 4 Piece Ensuite
13.75 x 10.3ft
About this Listing
Demand Yonge/Finch Location, *Newly Renovated* 2 Bedrooms Unit PLUS One Large Den, Approximately 980 Sq/Ft, Well Maintained Building, 24 Hrs Concierge, Direct Access To Subway Station, Walking Distance To Restaurants, Shops, Theatre, Library, Maintenance Fee Include All Utilities **Earl Haig SS School Zone!**
ExtrasFridge, Stove, B/I Dishwasher, Washer & Dryer, All Electric light Fixtures, Included One Parking And Locker.
sutton group-admiral realty inc.MLS® #C9302726
Amenities
Security System
Gym Room
Party Room
Concierge
Indoor Parking
Bike Storage
Explore Neighbourhood
9/10
Walkability
One small step for you. One giant leap towards never needing a gym membership.
10/10
Transit
Meet the heartbeat of the city — transit so smooth, you’ll never miss a beat.
5/10
Bikeability
You'll have a love-hate relationship with your gears. Mostly hate.
Similar Listings
Demographics
Based on the dissemination area as defined by Statistics Canada. A dissemination area contains, on average, approximately 200 – 400 households.
Population
16,570
Average Individual Income
$67,675
Average Household Size
3 persons
Average Age
42
Average Household Income
$115,798
Dominant Housing Type
Detached
Population By Age
Household Income
Housing Types & Tenancy
Detached
51%
Semi Detached
20%
Low Rise Apartment
12%
High Rise Apartment
7%
Duplex
7%
Marital Status
Commute
Languages (Primary Language)
English
54%
Cantonese
17%
Mandarin
13%
Other
12%
Tamil
3%
Tagalog
1%
Education
University and Above
28%
High School
27%
None
20%
College
16%
Apprenticeship
3%
University Below Batchelor
3%
Major Field of Study
Business Management
28%
Architecture & Engineering
18%
Health & Related Fields
11%
Social Sciences
10%
Math & Computer Sciences
7%
Physical Sciences
5%
Humanities
4%
Education
4%
Personal, Protective & Transportation Services
3%
Visual & Performing Arts
2%
Agriculture & Natural Resources
1%
Price Trends
Maintenance Fees
The Paramount Condos vs The Newtonbrook Area
Building Trends At The Paramount Condos
Days on Strata
Units at The Paramount Condos spend an average of
8
Days on Strata
based on recent sales
List vs Selling Price
On average, these condos sell for
3%
above
the list price.
Offer Competition
Condos in this building have an
AVERAGEchance of receiving
Multiple Offers
compared to other buildings in Newtonbrook
Turnover of Units
On average, each unit is owned for
5.4
YEARS before being sold againProperty Value
1%
Increase in property value within the past twelve months
Price Ranking
9th
Highest price per SQFT out of 40 condos in the Newtonbrook area
Sold Units
7
Units were Sold over the past twelve months
Rented Units
15
Units were Rented over the past twelve months
Best Value Rank
The Paramount Condos offers the best value out of 40 condos in the Newtonbrook neighbourhood
?
Appreciation Rank
The Paramount Condos has the highest ROI out of 40 condos in the Newtonbrook neighbourhood
?
Rental Yield
The Paramount Condos yields the highest rent prices out of 40 condos in the Newtonbrook neighbourhood
?
High Demand
The Paramount Condos is the most popular building out of 40 condos in the Newtonbrook neighbourhood
?
Transaction Insights at 39 Pemberton Avenue
| 1 Bed | 2 Bed | 2 Bed + Den | 3 Bed | |
|---|---|---|---|---|
| Price Range | $510,000 - $545,000 | $680,000 - $720,000 | No Data | No Data |
| Avg. Cost Per Sqft | $849 | $685 | No Data | No Data |
| Price Range | $2,400 - $2,500 | $2,900 - $3,300 | No Data | No Data |
| Avg. Wait for Unit Availability | 304 Days | 61 Days | 589 Days | 402 Days |
| Avg. Wait for Unit Availability | 80 Days | 26 Days | No Data | No Data |
| Ratio of Units in Building | 18% | 80% | 2% | 2% |
Transactions vs Inventory
Total number of units listed and sold in Newtonbrook
