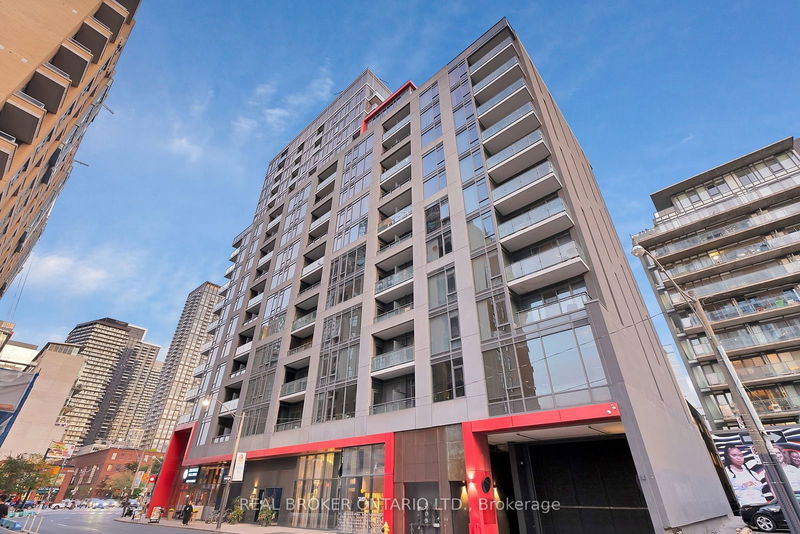
913 - 435 Richmond St W


Listing History
Unit Highlights
Utilities Included
Utility Type
- Air Conditioning
- Central Air
- Heat Source
- Gas
- Heating
- Forced Air
Room Dimensions
About this Listing
Discover the perfect blend of style and convenience in this stunning sun-soaked condo located in Toronto's vibrant Fashion District. Set in an intimate boutique building, this unit boasts breathtaking, unobstructed city views that greet you every day. The well-designed layout offers seamless living, with trendy cafes, gourmet restaurants, boutiques, and everyday essentials just steps away. Public transit is at your fingertips, and you're only a short stroll from the eclectic Kensington Market and the University of Toronto. Relax on the rooftop terrace and take in the panoramic skyline views. Move in and enjoy the ultimate urban lifestyle today!
ExtrasIntegrated Fridge, Dishwasher, S/S Hood Fan And Stove, Microwave, Front-Loading Stacked Washer & Dryer, Vertical Blinds, All Elfs. Amenities: Concierge, Exercise Room, Games Room, Party/Meeting Room, Rooftop Deck/Garden.
real broker ontario ltd.MLS® #C9357047
Amenities
Explore Neighbourhood
Similar Listings
Demographics
Based on the dissemination area as defined by Statistics Canada. A dissemination area contains, on average, approximately 200 – 400 households.
Price Trends
Maintenance Fees
Building Trends At Fabrik Condos
Days on Strata
List vs Selling Price
Offer Competition
Turnover of Units
Property Value
Price Ranking
Sold Units
Rented Units
Best Value Rank
Appreciation Rank
Rental Yield
High Demand
Transaction Insights at 435 Richmond Street W
| Studio | 1 Bed | 1 Bed + Den | 2 Bed | 2 Bed + Den | 3 Bed | 3 Bed + Den | |
|---|---|---|---|---|---|---|---|
| Price Range | No Data | No Data | No Data | $674,000 - $780,000 | No Data | No Data | No Data |
| Avg. Cost Per Sqft | No Data | No Data | No Data | $1,019 | No Data | No Data | No Data |
| Price Range | No Data | $2,250 - $2,300 | $2,475 - $2,700 | $2,550 - $3,625 | No Data | $6,000 | No Data |
| Avg. Wait for Unit Availability | 214 Days | 138 Days | 116 Days | 68 Days | No Data | 617 Days | No Data |
| Avg. Wait for Unit Availability | 167 Days | 52 Days | 60 Days | 26 Days | 1 Days | 265 Days | 253 Days |
| Ratio of Units in Building | 6% | 22% | 21% | 44% | 2% | 5% | 3% |
Transactions vs Inventory
Total number of units listed and leased in Queen West
