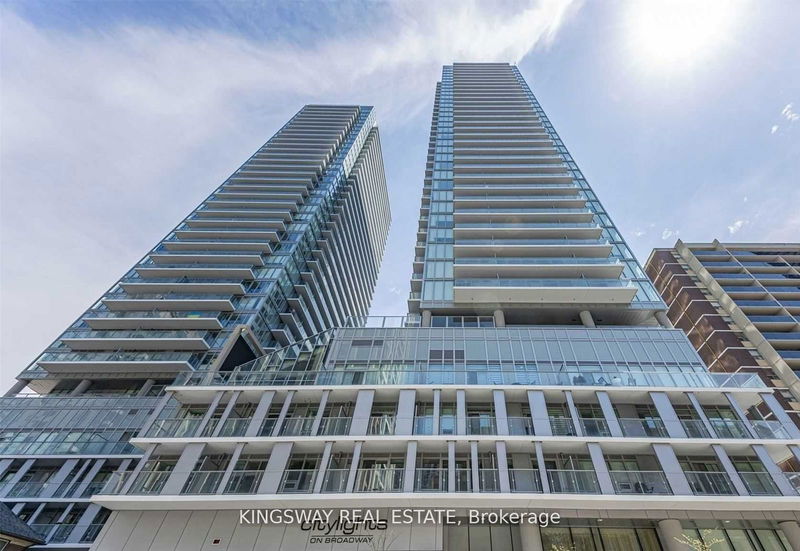
LPH02 - 99 Broadway Ave


Listing History
Unit Highlights
Utilities Included
Utility Type
- Air Conditioning
- Central Air
- Heat Source
- Gas
- Heating
- Forced Air
Room Dimensions
About this Listing
A MUST SEE LOWER PENTHOUSE UNIT ! Welcome to CITYLIGHTS ON BROADWAY Built By PEMBERTON GROUP. Beautiful modern condo located in the heart of Mid-town TORONTO with easy access to subway, TTC restaurants & Shops. This unit is Filled with natural light, has 2 full bathroom, modern kitchen, a nice open den which can be used as a home office or a junior bedroom. The Broadway Club Offers Over 18,000Sf Indoor & Over 10,000Sf Outdoor Amenities Including Outdoor Pool, Amphitheater, Party Rm W/ Chef's Kitchen, Fitness Centre and More! High Speed Internet, Water, Heat and Hydro included in monthly rent.
ExtrasStainless Steel appliances, window coverings, washer & Dryer.
kingsway real estateMLS® #C9306465
Amenities
Explore Neighbourhood
Similar Listings
Demographics
Based on the dissemination area as defined by Statistics Canada. A dissemination area contains, on average, approximately 200 – 400 households.
Price Trends
Maintenance Fees
Building Trends At CityLights on Broadway
Days on Strata
List vs Selling Price
Offer Competition
Turnover of Units
Property Value
Price Ranking
Sold Units
Rented Units
Best Value Rank
Appreciation Rank
Rental Yield
High Demand
Transaction Insights at 99 Broadway Avenue
| Studio | 1 Bed | 1 Bed + Den | 2 Bed | 2 Bed + Den | 3 Bed | 3 Bed + Den | |
|---|---|---|---|---|---|---|---|
| Price Range | $397,000 - $430,000 | $458,000 - $531,000 | $485,000 - $690,000 | $626,800 - $900,000 | $925,000 | No Data | No Data |
| Avg. Cost Per Sqft | $1,148 | $1,149 | $1,092 | $1,041 | $691 | No Data | No Data |
| Price Range | $1,900 - $2,200 | $2,050 - $2,500 | $2,100 - $2,700 | $2,150 - $3,500 | $3,250 - $4,000 | No Data | No Data |
| Avg. Wait for Unit Availability | 124 Days | 46 Days | 45 Days | 51 Days | 518 Days | No Data | No Data |
| Avg. Wait for Unit Availability | 14 Days | 4 Days | 4 Days | 5 Days | 120 Days | No Data | No Data |
| Ratio of Units in Building | 11% | 29% | 31% | 29% | 2% | 1% | 1% |
Transactions vs Inventory
Total number of units listed and leased in Mount Pleasant East
